Scientists Are Building the Ultimate Milky Way Map. Here's What They Have So Far
Peruse strange starquake sightings, cosmic DNA secrets, all of our solar system's asteroids and so much more.


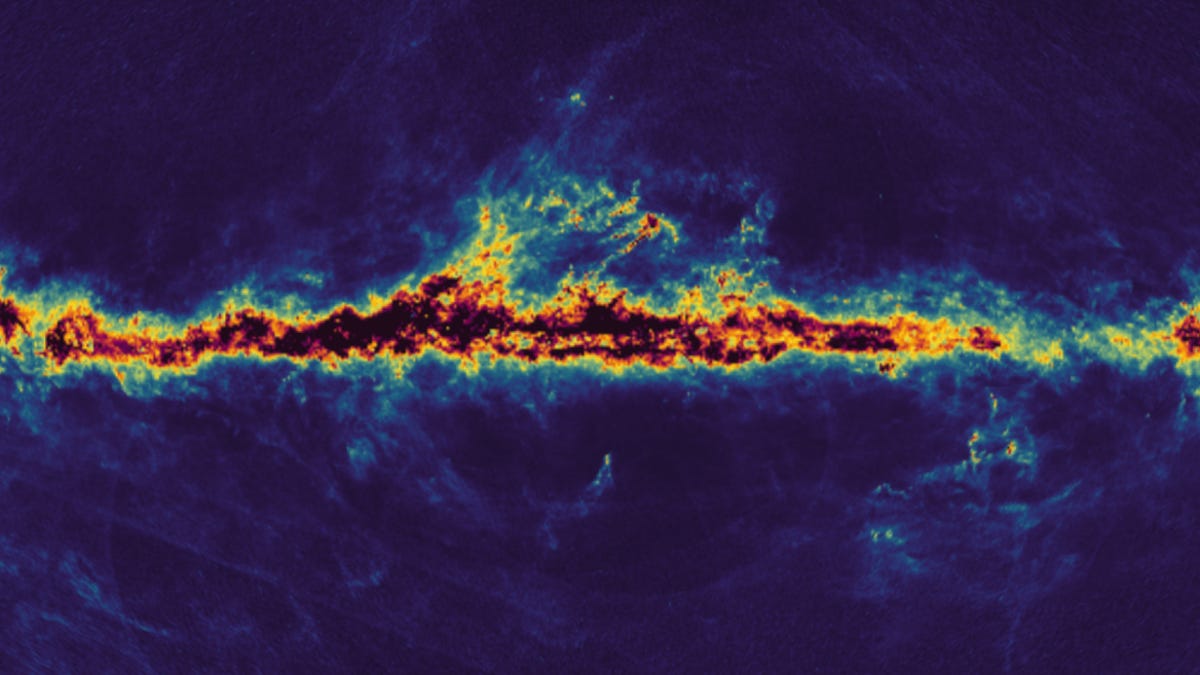
This map shows the interstellar dust that fills the Milky Way. The dark regions in the center of the galactic plane in black have a lot of interstellar dust, fading to yellow as the amount of dust decreases. The dark blue regions above and below are areas with little dust.
Beyond the realm of mind-blowing spaceflight, groundbreaking satellites and stunning moon landings, the European Space Agency is focused on one crucial quest. It's simply to "create the most accurate and complete multidimensional map of the Milky Way."
The ambitious endeavor is called Gaia, and for the last several years, ESA has been steadily making progress on the dream. Scientists who're part of the collaboration have collected tons of spectacular data about the more than 1 billion stars throughout our galaxy, recording every juicy detail along the way.
And on Monday, the team reached a massive checkpoint for the project.
Lucky for us, it also released some remarkable visuals, which encompass the treasure box of cosmic secrets gathered so far. This particular milestone is formally referred to as Gaia data release 3, and importantly, it's one that ESA says is the "most detailed Milky Way survey to date."
In this dataset, not only can you see thousands of solar system objects, like asteroids, moons and other celestial marvels within our galaxy, but you can also peruse millions of galaxies and phenomena outside the Milky Way.
The position of each asteroid at 12:00 CEST on June 13, 2022, is plotted. Blue represents the inner part of the solar system, where the near-Earth asteroids, Mars crossers and terrestrial planets are. The main belt, between Mars and Jupiter, is green. The two orange "clouds" correspond to the Trojan asteroids of Jupiter.
When you look at the stats of this survey, it really is jaw-dropping. This new wealth of galactic intelligence includes some 6.6 million quasar candidates with redshift estimates, aka the extremely bright jets that power supermassive black holes, and probably their precise locations. It boasts 4.8 million galaxy candidates, about 813,000 multistar systems, 2.3 million hot stars and so much more.
"Gaia is a survey mission. This means that while surveying the entire sky with billions of stars multiple times, Gaia is bound to make discoveries that other more dedicated missions would miss," Timo Prusti, project scientist for Gaia at ESA, said in a statement.
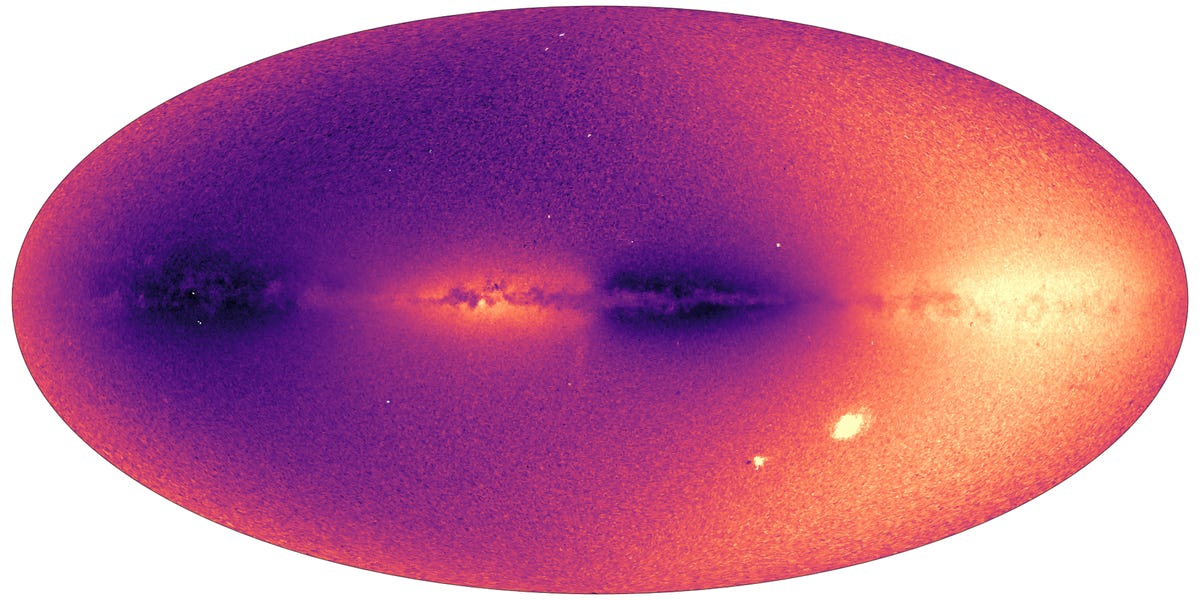
The Large and Small Magellanic Clouds appear as bright spots in the lower right corner of the image. The Sagittarius dwarf galaxy is visible as a faint quasi-vertical stripe below the galactic center.
A few interstellar surprises
According to the team, among the most surprising discoveries of Gaia's data release 3 are strange phenomena called "starquakes."
Starquakes are pretty much exactly what they sound like – tiny motions on the surface of a star that can alter its orblike shape. Some of these quakes ESA compares to vibrations we associate with "large-scale tsunamis" on Earth.
"Starquakes teach us a lot about stars, notably their internal workings. Gaia is opening a goldmine for 'asteroseismology' of massive stars," Conny Aerts of KU Leuven in Belgium, and a member of the Gaia collaboration, said in a statement.
Asteroseismology is to stars what seismology is to Earth, the study of quakes and other such wave propagation. A rundown of the starquake portion of Gaia's new data can be seen below.
Another striking revelation was that the Gaia telescope duo – which harnesses a whopping 1-billion-pixel camera – could detect the chemical composition of the stars being studied. This one's a big deal that could revolutionize the field of astronomy.
In short, understanding the breakdown of which exact chemicals lace stellar objects could help us decode when they were born, where they were born and what trajectory they followed after they were born. It could reveal a timeline of the universe.
And with the new Gaia data, the team found that some stars had heavier elements than others. Heavier elements are often metals, and differentiate themselves from lighter elements because they have a different nuclei structure.
This all-sky view shows a sample of the Milky Way stars in Gaia's data release 3. The color indicates the stellar metallicity. Redder stars are richer in metals.
But the main point here is that lighter elements, from what experts know thus far, are thought to be the only kind present during the Big Bang. In essence, this means Gaia data release 3 offers direct proof of a super diverse combination of stars in our galaxy in terms of both time and place of genesis.
"This diversity is extremely important, because it tells us the story of our galaxy's formation," Alejandra Recio-Blanco of the Observatoire de la Côte d'Azur in France, and a member of the Gaia collaboration, said in a statement. "It reveals the processes of migration within our galaxy and accretion from external galaxies."
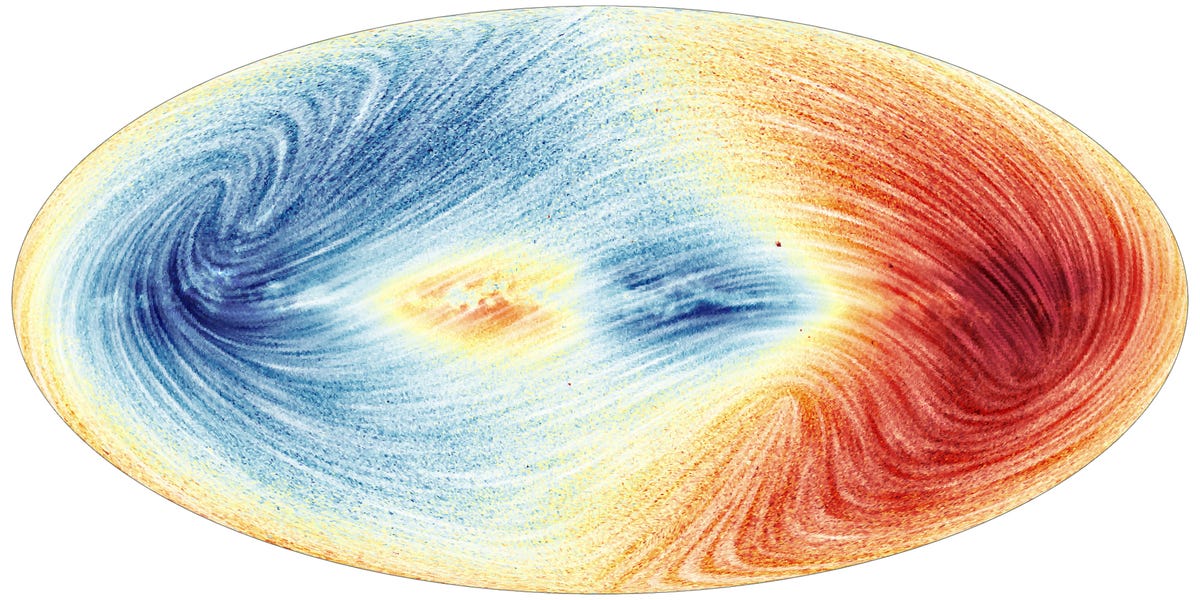
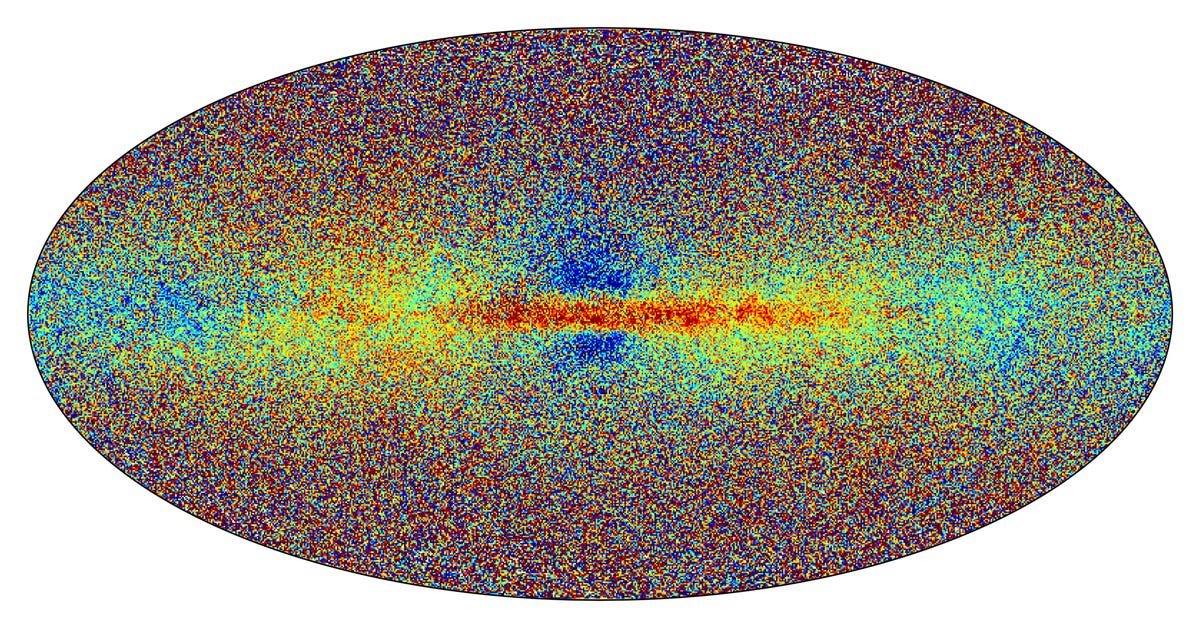
This sky map shows the velocity field of the Milky Way for about 26 million stars. Blue shows the parts of the sky where the average motion of stars is towards us, and red shows the where the average motion is away from us.
Taking this all a step further, viewing the efforts of Gaia kind of reminds us of our place in the universe. Mapping a region far, far vaster than Earth's immediate neighborhood inevitably forces human existence into perspective.
As Recio-Blanco puts it, "It also clearly shows that our sun, and we, all belong to an ever changing system, formed thanks to the assembly of stars and gas of different origins."
Other remarkable sightings with Gaia include over 800 binary star systems, which refer to two stars orbiting one another, in contrast to our solar system's singular sun, and a new asteroid survey comprising 156 ,000 rocky bodies.
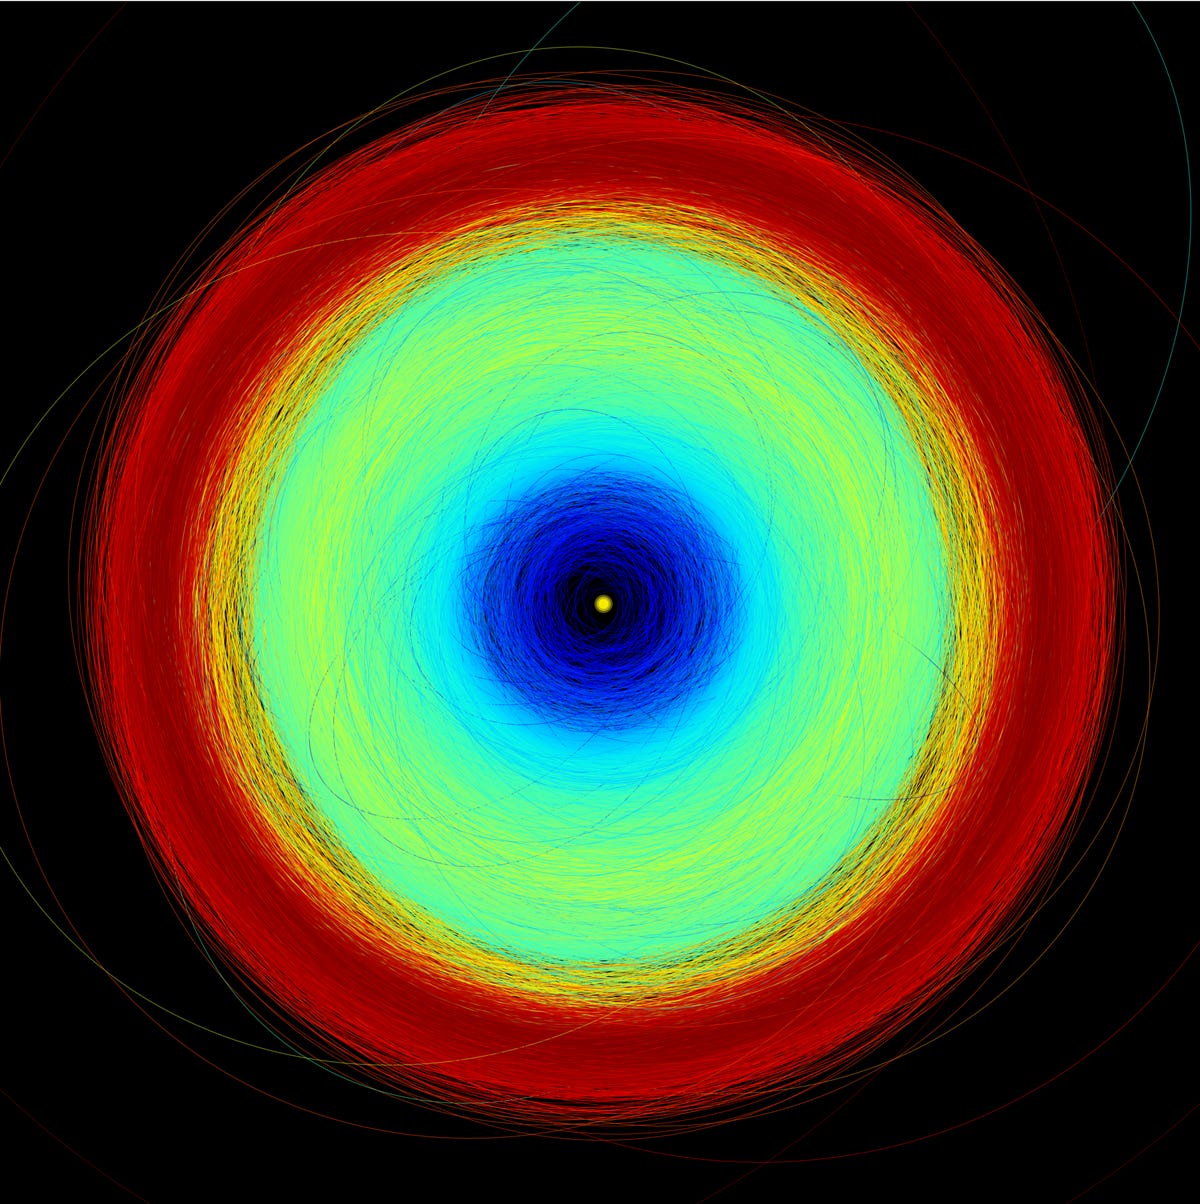
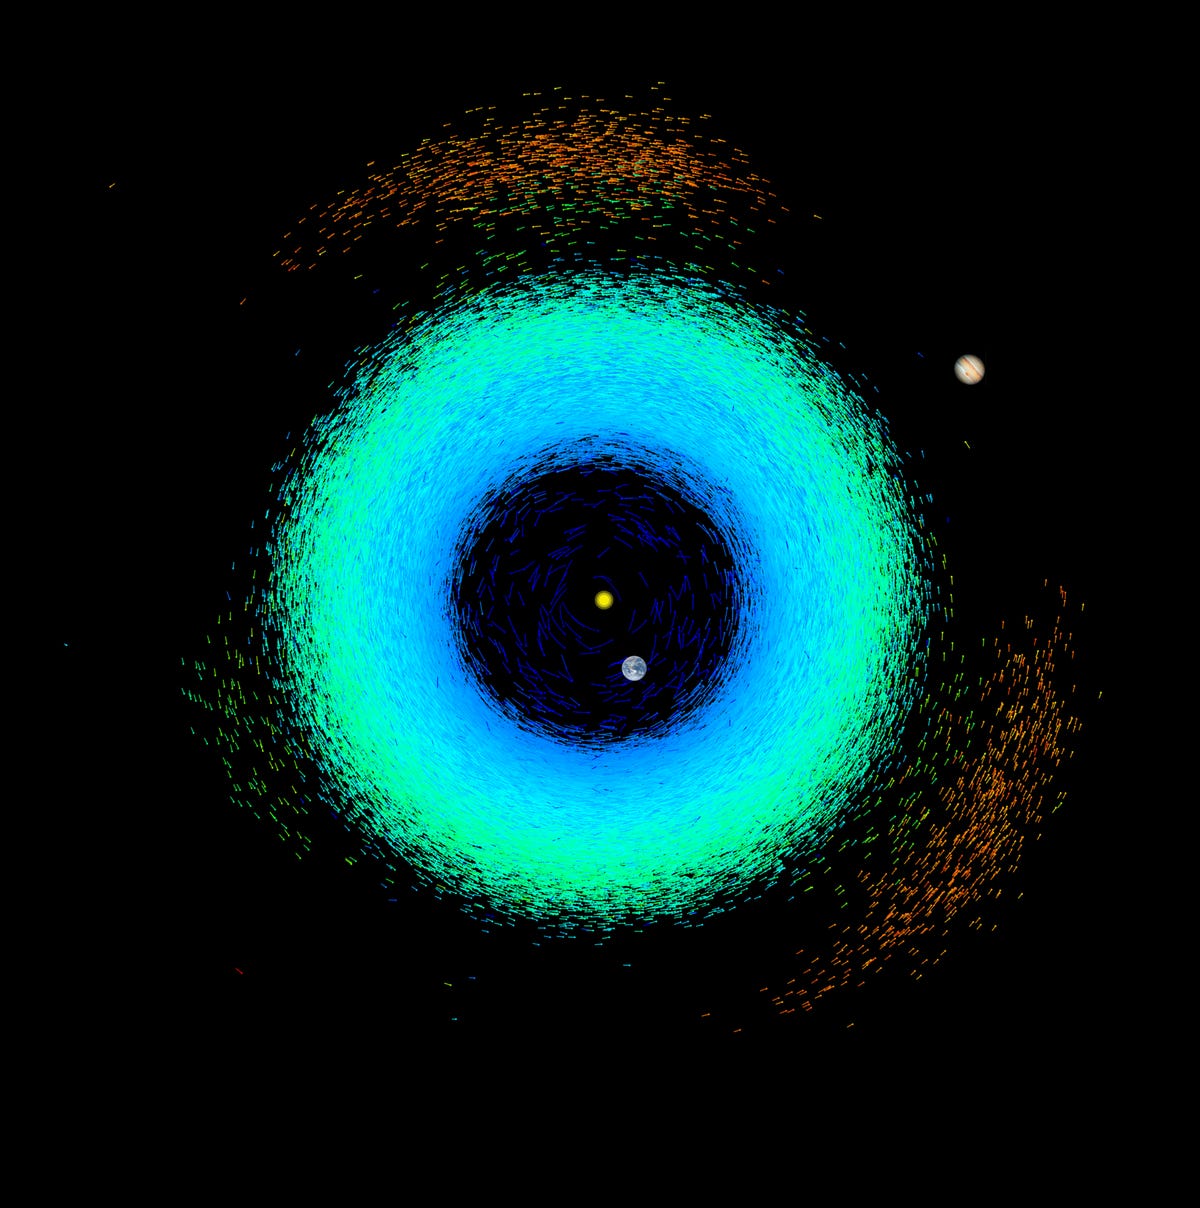
This image shows the orbits of the more than 150,000 asteroids -- from the inner parts of the solar system to the Trojan asteroids at the distance of Jupiter. The yellow circle at the center represents the sun. Blue represents the inner part of the solar system, where there are near-Earth asteroids, Mars crossers and terrestrial planets. The main belt, between Mars and Jupiter, is green. Jupiter Trojans are red.
"We can't wait for the astronomy community to dive into our new data to find out even more about our galaxy and its surroundings than we could've imagined," Prusti said.
And with regard to Gaia's own next steps, the team intends to continue toiling away at what will eventually be the pinnacle of lore for our home galaxy, the Milky Way.

This image shows an artistic impression of the Milky Way, and on top of that an overlay showing the location and densities of a young star sample from Gaia's data release 3 (in yellow-green). The "you are here" sign points towards the sun.