The science of hearing
If you want to understand the science of music, you need to understand how the ear works. And to understand how the ear works, you need to understand equal loudness contours.
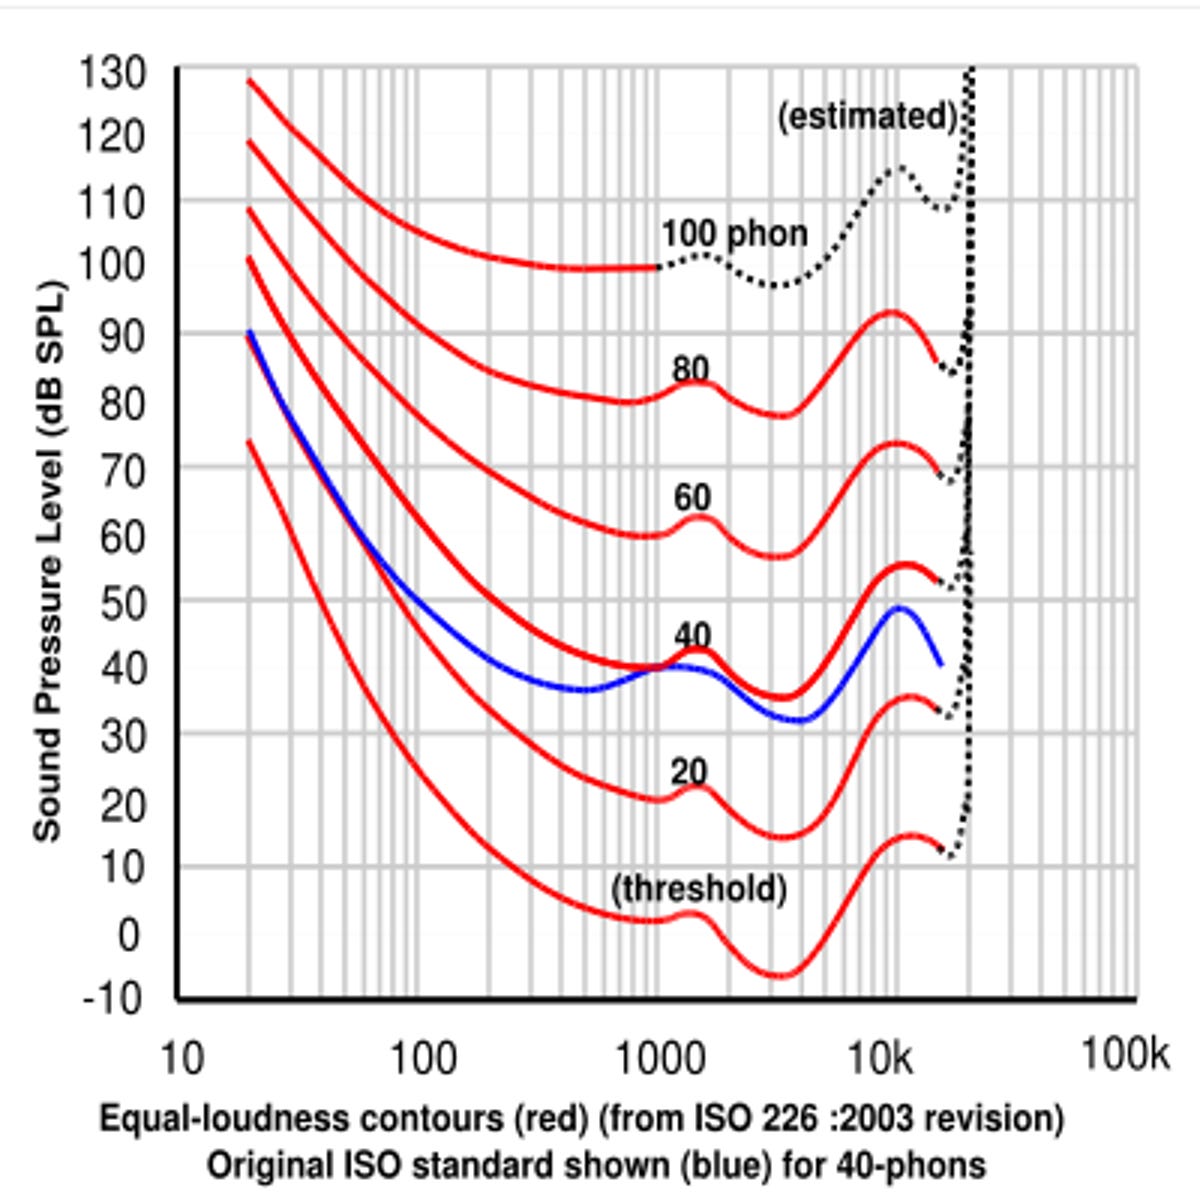
The graphic on this page, taken from a Wikipedia entry, shows the current ISO standard for something called equal loudness contours.
If you've studied audio production or audio equipment, you might have seen this or similar charts. (The earliest version, created in 1933, was known as the Fletcher-Munson curve, and recent studies have proven it was quite accurate.) But what does it mean?
The horizontal x-axis represents pitch, measured in Hertz (Hz), or vibrations per second. The lowest threshold of human hearing is around 20 Hz--that would be a very low bass note on a church organ. Human voices range between 300 Hz to 2,000 Hz (or 2 kiloHertz, kHz). For reference, a pure 1,000 Hz tone is generally used. It sounds like a medium-high-pitched beep. The high-end of human hearing is around 20 kHz.
The vertical y-axis represents loudness, measured in sound-pressure-level decibels (dB SPL). Zero dB is defined as the level at which 50% of people hear the 1,000 Hz reference tone. It's exceptionally soft. This is a logarithmic scale, so the level of sound doubles every 3 dB (which is surprisingly not-noticeable). Ambient noise in an office building might be around 50 dB. Conversation is around 70 or 80. The volume from the soundboard at a rock concert is around 100. Front row at a Motorhead concert is probably pushing 120. A jet taking off might be 125, and the threshold of pain is about 140.
But the curves are the interesting part. They represent how the human ear perceives loudness at different pitches. Take that bottom line. A pure tone at 1000 hZ measured at 0 dB is barely perceptible to the human ear--that's the definition of 0 dB, after all. But follow the line to the left, and note how it curves sharply upward the lower the tone gets. That means that a 20hZ tone--a very low bass note--has to be played at 75dB before it's audible. In other words, that note has to be played approximately 33 million times louder.
The contour isn't nearly as acute at higher volumes--at rock-band volumes, the lowest bass note needs to be only 25dB, or 256 times, louder to be perceived the same as the vocalist's 1,000 kHz wail. (In fact, no instrument but a wave synth produces a pure tone, but we're talking averages.) At any rate, the contour explains why bass amps have to have more wattage (300 is good) than guitar amps (which can stand out in a non-mic'ed setting at even 25 watts): the bass has got to be much louder on an absolute level before it sounds equal to the guitar and vocals. Dedicated sub-woofers can be justified in part for the same reason.
The curve also contains other interesting information. For example, see that dip around 2kHz? That's where our hearing is most acutely sensitive--the high-end of human speech. Any new parent can probably guess why. Evolution at work: the parents who were able to sleep through their baby's wails didn't wake up to get their children out of danger, hence, that undesirable trait was culled from the herd. And that's the reason why the U.S. military reportedlyplays high-volume recordings of babies crying as a way to get prisoners to talk--it's not quite torture, but it's certainly annoying and unignorable.