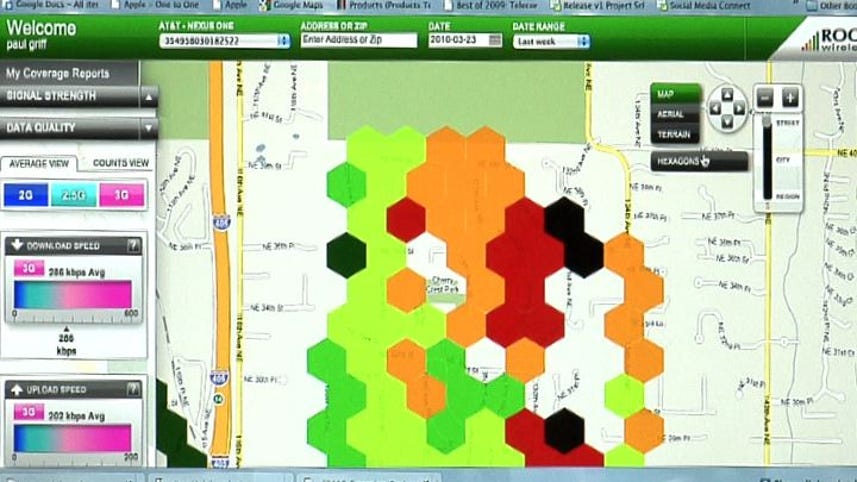
[ Background music ] >> Kent German: I'm Kent German Senior Editor at CNET.com. I'm here at CTIA 2010 in Las Vegas. I'm here with Paul Griff the CEO of Root Wireless. Root Wireless is announcing something at CTIA which is pretty exciting which is now all the users out there so cell phone users across the country whether you look at CNET or not can actually download an application to their phone and they can actually track the data, help track this data themselves so Paul is gonna show you is actually his personal page that this is the data that he's tracked, up in Seattle so we're looking at Seattle not Las Vegas. So tell me Paul what are we looking at here? >> Paul Griff: Well so we're looking at the area around where I live and around where my office is and what we're seeing here is data that's color coded to show you at the moment what we're seeing is signal quality. So as you see dark green, that's a grade a 4 bar signal on a 4 bar scale as you get into yellows we're down into 3 bars, orange and red get down to 2 bars in one, and in spite the fact that we're in suburban Seattle in a pretty densely populated area here, you see on AT&T there are a number of red and even several black hexagons. Those black hexes represent dead zones, place that we weren't able to get any signal at all. >> Kent: And you have coverage with all the carriers, major carriers right? >> Paul: All 4 of the majors and certainly in areas where other carriers are prominent we'll be able to collect that data as well as long as we've got a rim or Android supported device. So I'm using a Nexus One here on AT&T and this is what the app looks like. Today it's extremely simple. Most of its work happens in the background without any user interaction. Wakes up a couple of times an hour, takes a geo location reading, grabs signal quality data, runs a speed test. You have the ability on the device to look at that information as it's being gathered and then every hour the device automatically forwards information to our servers and which point you can see it on personal page. >> Kent: And it runs in the background right so it's not gonna zap a lot of your battery? >> Paul: Correct >> Kent: What do some of the controls do? >> Paul: So if you've had a dropped call or you have an inability to connect to the data network you can trigger a test sequence and you can let the math know where you've had that problem, or if you're like most people that have some spot on their commute where they have a real hard time, they know there's a trouble area you can click test my network and what it does it runs a 10 minute pretty heavy duty test, mapping the areas that you're passing through for the next 10 minutes. >> Kent: Ok >> Paul: All of that data's viewable on the map not only for signal quality but we can look at this as well from a data quality perspective and >> Kent: So that just show this isn't voice right it just shows data? >> Paul: This is purely data. All you're seeing on the map here is the pink or fuchsia color represents a 3G signal. This one blue spot there is representing a 2.5 G signal and if we look at the data quality information in detail, we can look at it to see what your average uplink speeds and download speeds are and then if you click on any single hex, and this works by the way for signal quality as well, you're able to see in that location whether it's 3G and what the upload and download speeds are. >> Kent: So what's great about this map and the app of course is that it does drill down that data to a really fine detail. You don't just get a promise from your carrier, you don't get a map that's just colored in shades and might be good here, might not be good there, it's very fine data. You can use it to rate carriers, make a better carrier choice and make a better phone choice as well and right now only on CNET. [ Background music ] I'm Kent German here at CTIA 2010. ^M00:03:41 [ Music ]