Google Analytics goes with the flow for visual oomph
Users of Google Analytics are about to be treated to two major new functions that should better explain traffic on their sites.


SAN FRANCISCO--Up until now, Google Analytics hasn't offered too much information on the way visitors move around a given site.
Susan Wojcicki, senior vice president of advertising at Google, took the opportunity of her speaking time allotment at the Web 2.0 Summit here this morning to unveil new functionality and features for Google Analytics.
Google Analytics is a free tool that that enables Web site and application developers (or simply anyone who is concerned with their site's traffic) to be able to understand traffic information better.

Wojcicki said that inspiration for these new features came from an unusual place: the 19th century.
In order to process how users are moving around a particular sight, Google's new concept is based on Charles Joseph Minard's famous graph of Napoleon's march toward Moscow, which details how many soldiers continued, deflected, returned, and so on. It shows time and motion, and it tells a story, Wojcicki said.
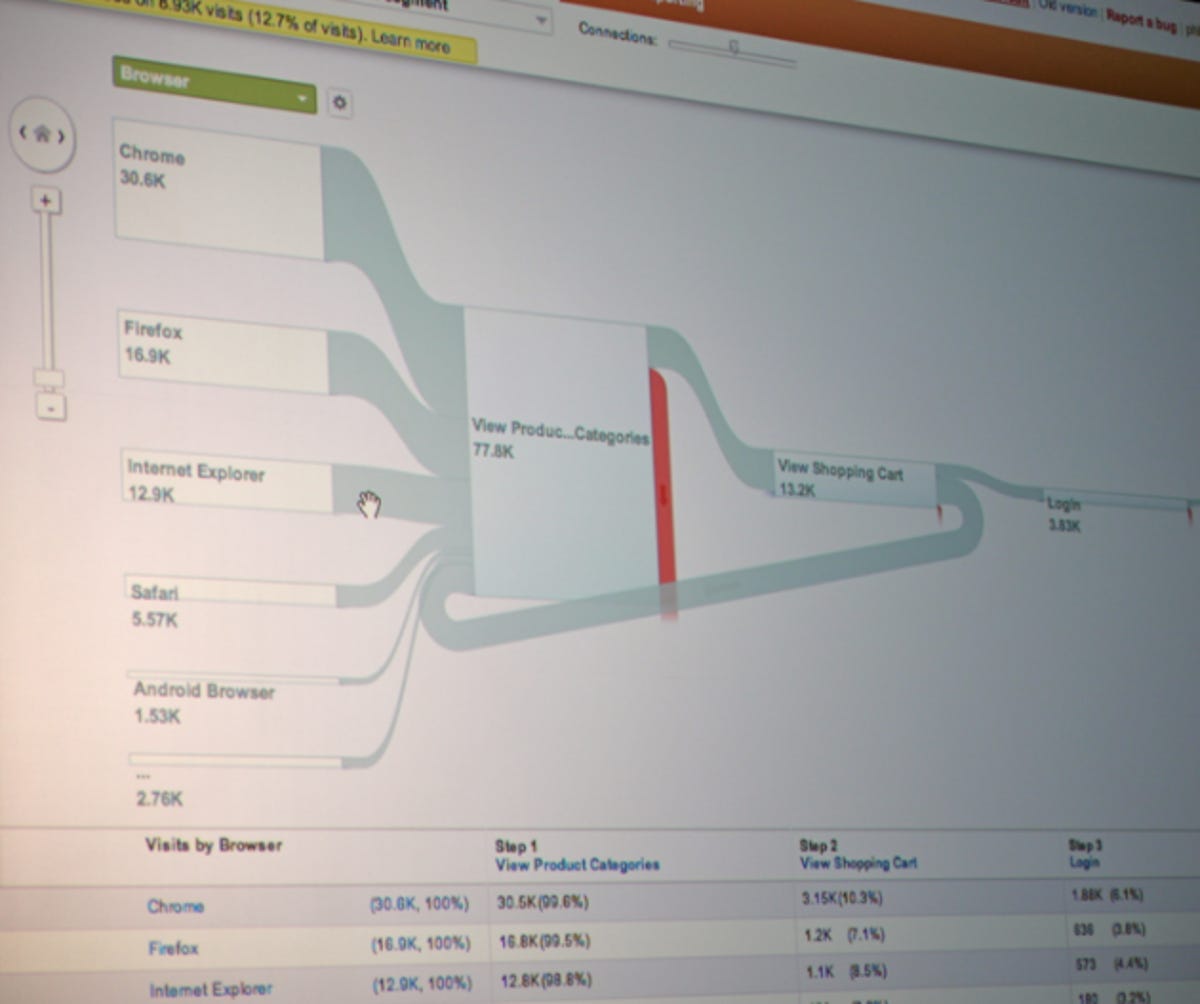
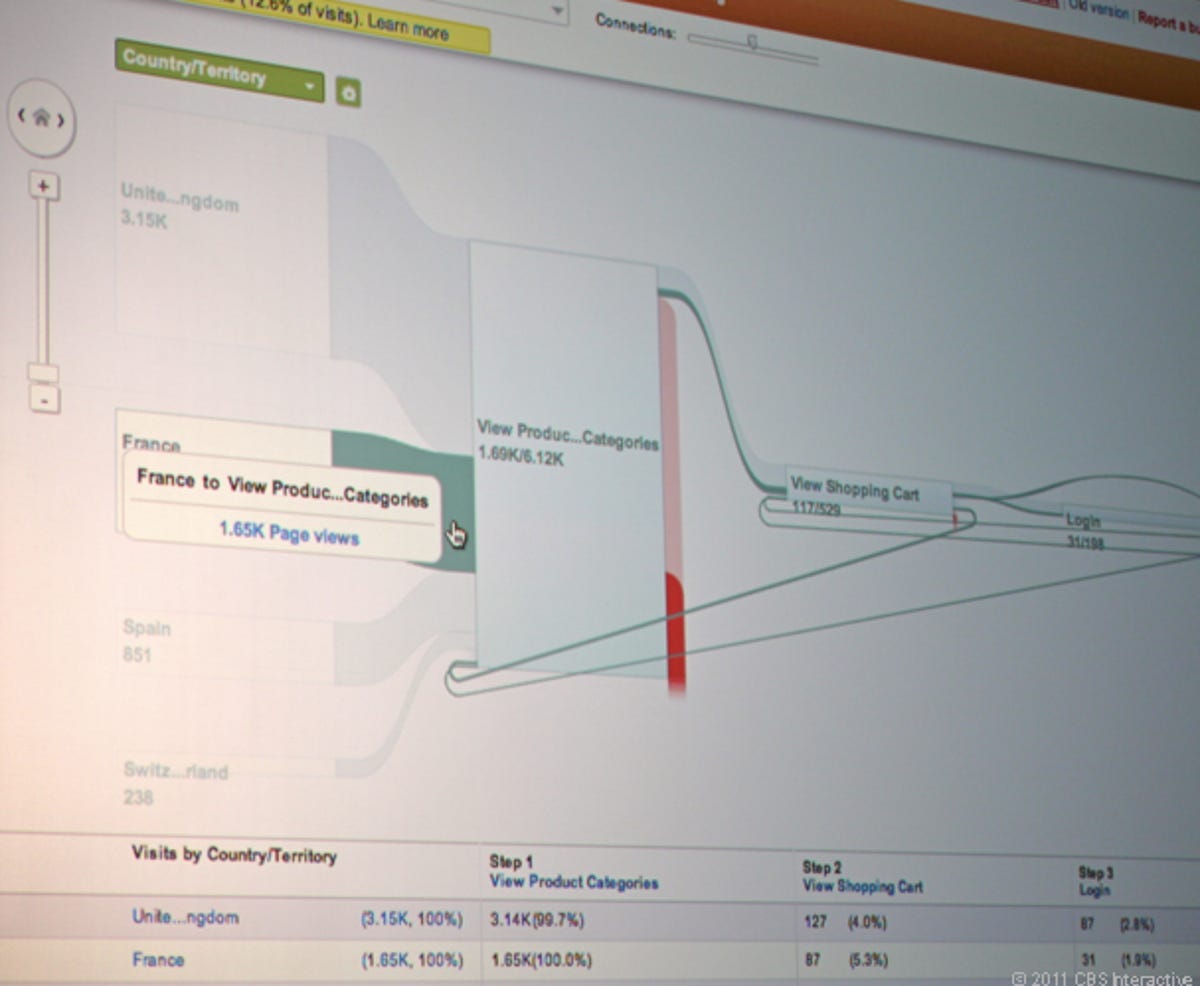
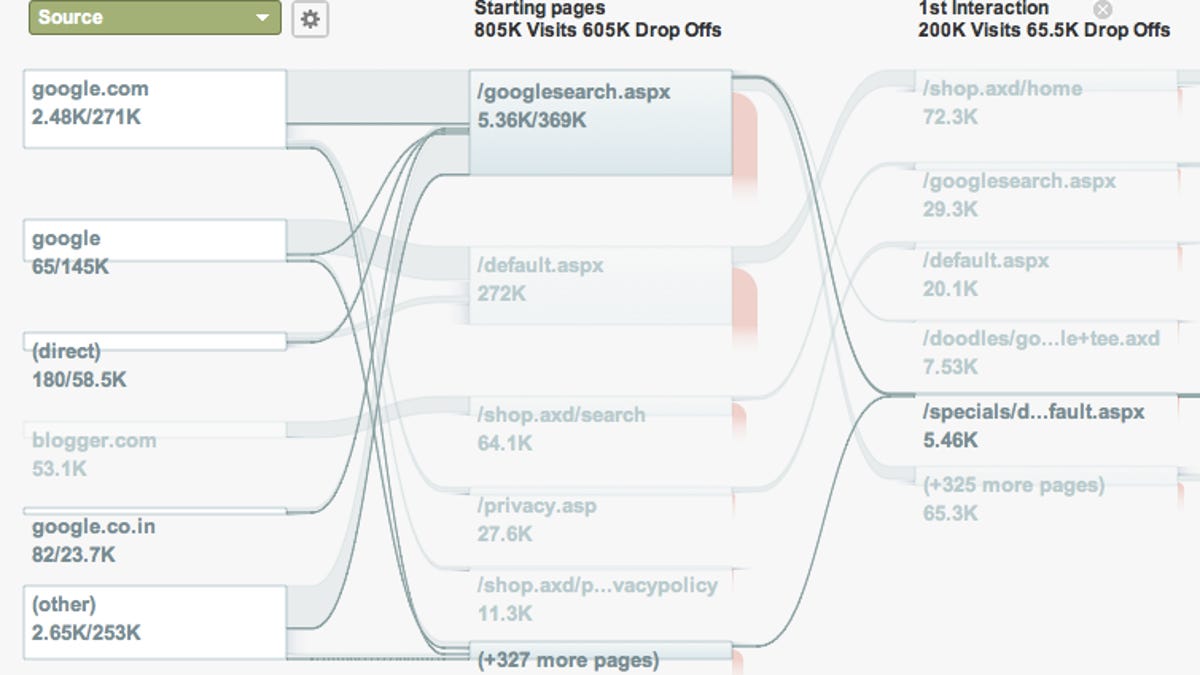
But it's still static, she acknowledged. So Google took the information and made it "dynamic," Wojcicki explained, by integrating this style of diagram and renaming it as "flow visualization."
"What makes the flow visualization so powerful is that it takes data and tells a story that is understood within seconds," said Wojcicki.
Launching today and rolling out to all Google Analytics over the next few weeks, users can sort by many different criteria options, such as by browser or customizable details.
The other major new introduction is "real time," which is also rolling out over the next few weeks. Basically, users can see how many active users there are on a particular site in real time.
Wojcicki used the Google Store's Web site to exemplify this, and it showed 60 active users when she started the presentation, but that number climbed rapidly during the presentation--probably as audience goers wanted to see if this worked, which it did.
However, it would have been far more interesting to see how many active users there are on Google.com.
Two views of Google Analytics in action