Neighborhoods with more crime have more Uber rides
By studying patterns for ride requests and crimes such as theft and prostitution, Uber engineers are figuring out when and where you're likely to want to book a ride.


As you're probably painfully aware, your ability to get a cab typically is inversely proportionate to how badly you need one. Rush hour, rain, important business meetings, and flights are all key indicators that you will be left cold and shivering on a dark and damp street corner while every passing cab gives you the virtual finger.
But the good engineers and data geeks at private car network Uber have turned to math to scientifically figure out the best way to predict car hire demand so they can make sure you'll be able to find a Town Car when you want one. Their methods, however, are straight out of Freakonomics.
Census data might seem like a sensible data trove to use, but it's not at all useful for figuring out the concentration of where people work, and it's even less helpful for figuring out where they go to party. But rather than counting bars, credit-card spending, or Foursquare check-ins, Uber engineers focused on another potential predictor of population density: crime.
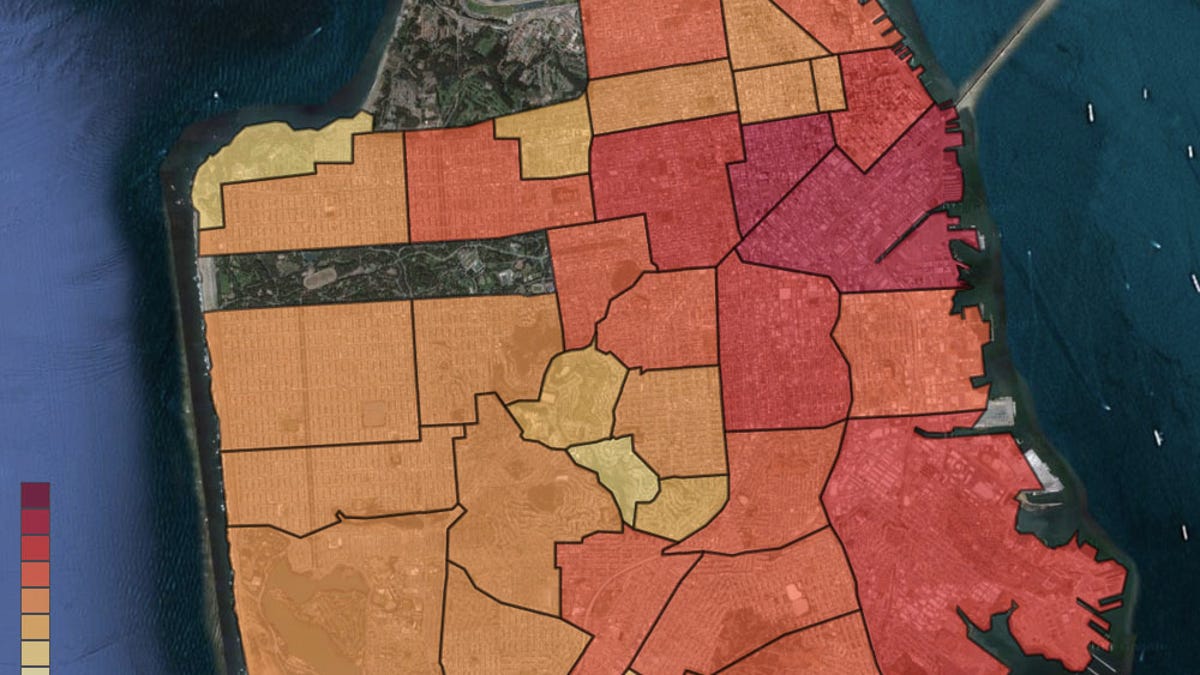
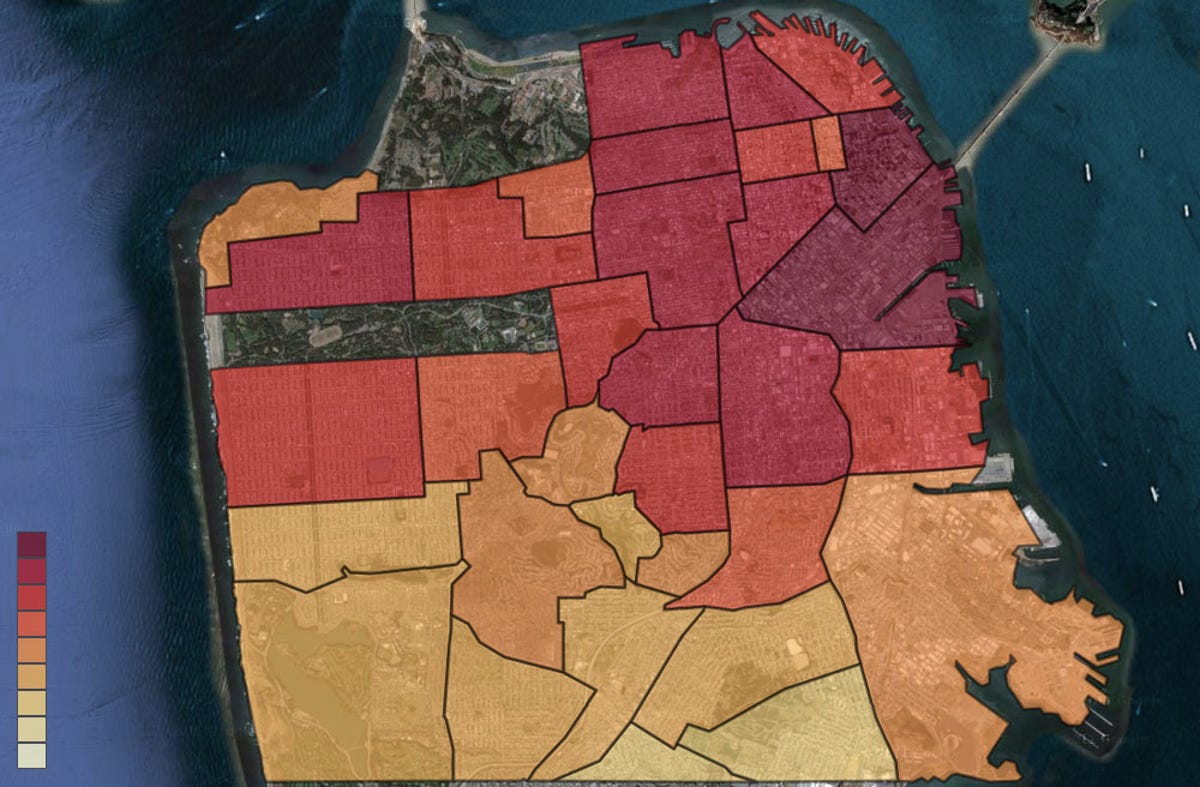
To figure out how best to distribute a limited supply of drivers, the data team studied crime incidents on San Francisco Crimespotting. Their logic is that crime occurs mostly where people are, and by mapping San Francisco Uber members' ride patterns, population density maps, and crime hot spots, they found that neighborhoods with more crime have more Uber rides.
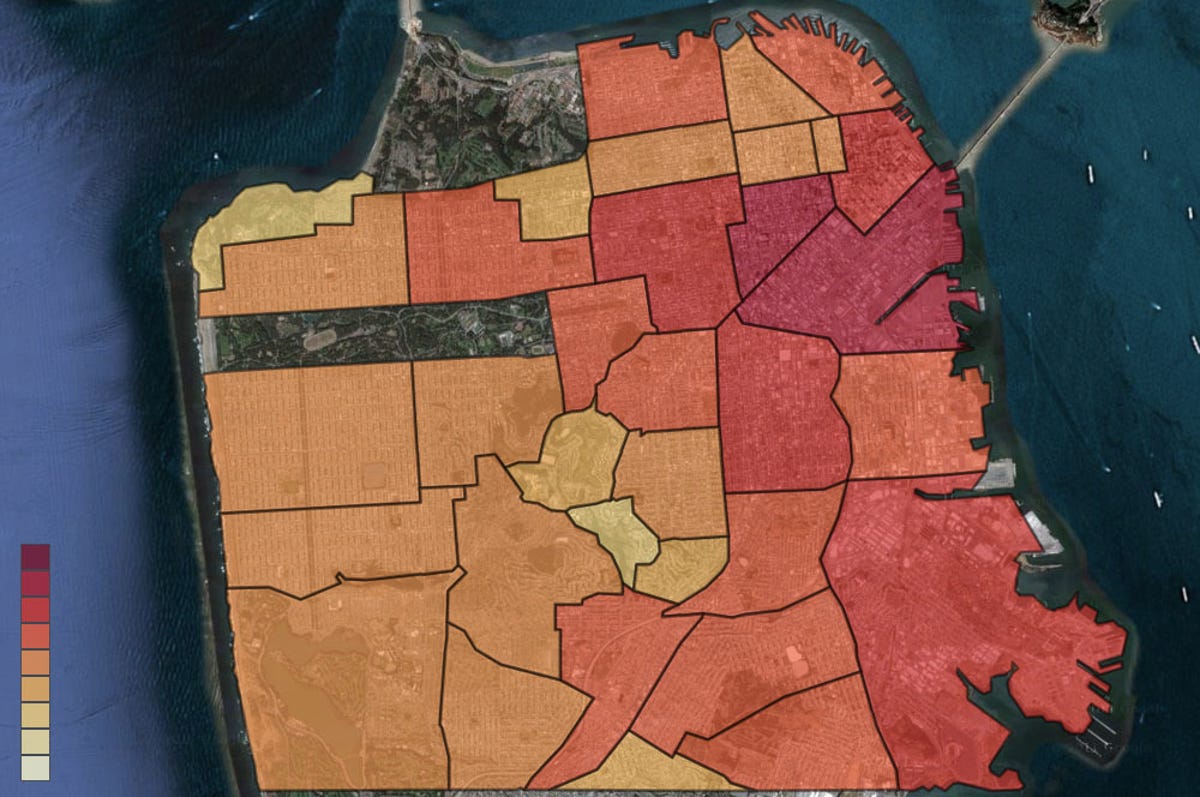
But it's not just any crime that mattered. The engineers found that the parts of San Francisco that have the most crimes related to prostitution, alcohol, theft, and burglary were the harbingers of peak demand zones. Incidentally, they also discovered that there are significantly more prostitution crimes on the second Wednesday of each month compared to the first, but they didn't specify if ride requests also spiked on those days.
Of course, no one is indicating that Uber passengers are the cause of these crime patterns, nor should the correlation be made that if you have a hard time getting a Uber ride on the second Wednesday of every month that it's because of a busier...umm..."hump day" than usual. This data simply points out that where there are more people, there are more incidents of prostitution, theft, and alcohol-related crimes. And also, where there are more people, there is also more demand for Uber. The end result of this research project probably means that Uber will be sending more cabs to the more raucous neighborhoods, making it easier to get out of trouble hot spots when you need to.