Average new-vehicle fuel economy the best it's been in years
It would be better if we weren't all buying massive crossovers, but it's a win nevertheless.


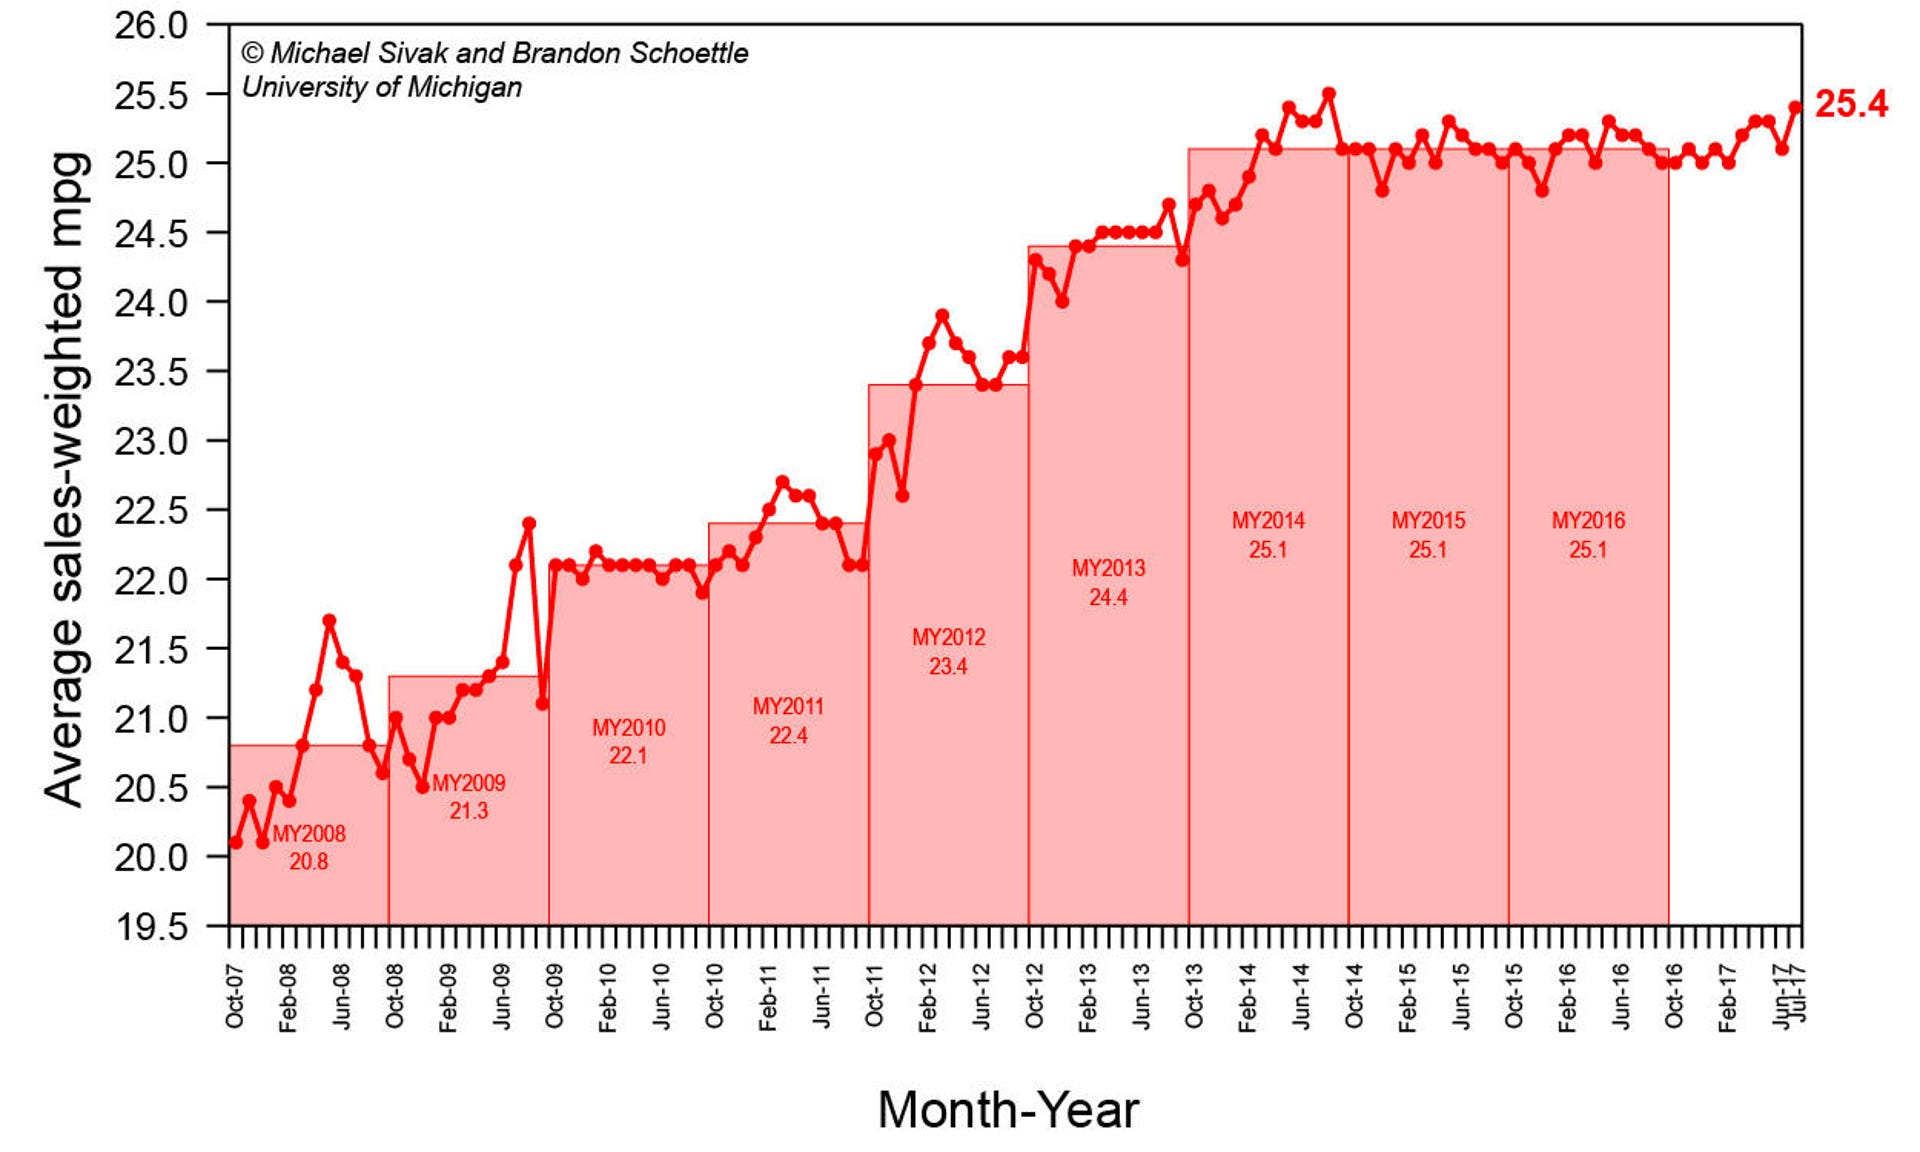
Every month, researchers from the University of Michigan's Transportation Research Institute (UMTRI) compile an average fuel economy for new vehicle sales. For the first time in years, we're getting close to record highs.
The sales-weighted average fuel economy for new light-duty vehicles reached 25.4 mpg in July 2017, according to UMTRI's number crunching. The highest recorded number in UMTRI's data set was back in August 2014, at 25.5 mpg, so July 2017's number is very close to a record high. The last few years have seen averages hovering around 25.0, with random dips and drops along the way.

We're slowly getting there...
UMTRI's data goes all the way back to the 2008 model year, so you can see just how sharply this average has risen over the last decade. Things finally started evening out in the 2014 model year, and the subsequent three model years have all held the same average at 25.1 mpg.
Considering that the market has not stopped its shift toward larger crossovers, which can be thirstier than comparable sedans, the rising fuel economy average is a good sign. Cars are getting more efficient, and as electrified offerings increase and are included alongside gas-powered versions of the same vehicle, this number will likely continue to rise in the coming years, unless Ford starts offering free pickup trucks to literally anyone with a pulse.
It's not a perfect window into how efficient our new cars are, as there are some averages taken and assumptions made through the process, but it's as good a marker as any, especially given just how far back UMTRI covers with its data.
Here's a full table, in case the graph isn't doing it for you:
UMTRI average sales-weighted fuel economy
| January | February | March | April | May | June | July | August | September | October | November | December | |
| 2007 | 20.1 | 20.4 | 20.1 | |||||||||
| 2008 | 20.5 | 20.4 | 20.8 | 21.2 | 21.7 | 21.4 | 21.3 | 20.8 | 20.6 | 21.0 | 20.7 | 20.5 |
| 2009 | 21.0 | 21.0 | 21.2 | 21.2 | 21.3 | 21.4 | 22.1 | 22.4 | 21.1 | 22.1 | 22.1 | 22.0 |
| 2010 | 22.2 | 22.1 | 22.1 | 22.1 | 22.1 | 22.0 | 22.1 | 22.1 | 21.9 | 22.1 | 22.2 | 22.1 |
| 2011 | 22.3 | 22.5 | 22.7 | 22.6 | 22.6 | 22.4 | 22.4 | 22.1 | 22.1 | 22.9 | 23.0 | 22.6 |
| 2012 | 23.4 | 23.7 | 23.9 | 23.7 | 23.6 | 23.4 | 23.4 | 23.6 | 23.6 | 24.3 | 24.2 | 24.0 |
| 2013 | 24.4 | 24.4 | 24.5 | 24.5 | 24.5 | 24.5 | 24.5 | 24.7 | 24.3 | 24.7 | 24.8 | 24.6 |
| 2014 | 24.7 | 24.9 | 25.2 | 25.1 | 24.4 | 25.3 | 25.3 | 25.5 | 25.1 | 25.1 | 25.1 | 24.8 |
| 2015 | 25.1 | 25.0 | 25.2 | 25.0 | 25.3 | 25.2 | 25.1 | 25.1 | 25.0 | 25.1 | 25.0 | 24.8 |
| 2016 | 25.1 | 25.2 | 25.2 | 25.0 | 25.3 | 25.2 | 25.2 | 25.1 | 25.0 | 25.0 | 25.1 | 25.0 |
| 2017 | 25.1 | 25.0 | 25.2 | 25.3 | 25.3 | 25.1 | 25.4 |