Testing data speeds in New York
CNET editors Jeff Bakalar and Bonnie Cha take to the streets of New York to put the four major cell phone carriers to the test. See which provider offered the fastest data speeds. The result might surprise you.


Recently, AT&T completed upgrades to its 3G network in New York City, more specifically in Manhattan, Brooklyn, Queens, and the Bronx, and the carrier was hopeful that its customers would see improved 3G performance voice and data performance during peak hours.
Wanting to put AT&T's claims to test, we asked you to share your experiences with us, and the results were mixed; some of you said service was worse, while others said it was about the same, and still, a few said performance was better.
Unfortunately, without having any data from before the AT&T network upgrade, it's hard for us to do a before and after comparison, but we thought it would be a good opportunity to do a data speed comparison among the four major U.S. carriers. In an ideal world, we would conduct these tests over an extended period, but time constraints and other responsibilities prevent us from doing so right now. Still, we wanted to provide you with a snapshot of what we experienced on a weekday in New York.
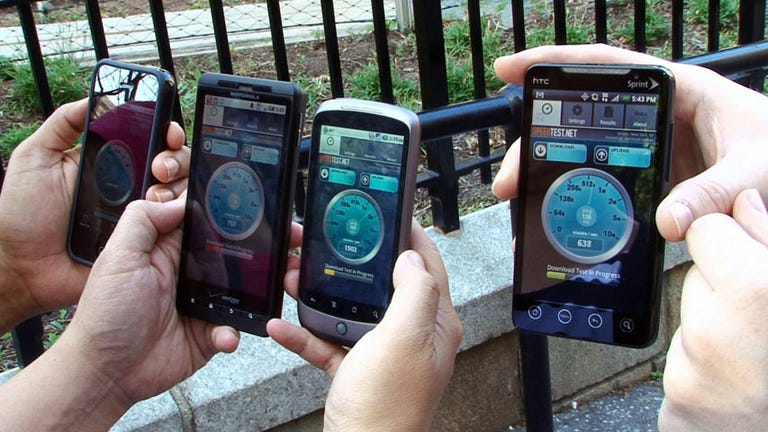
We conducted the tests on a Thursday afternoon and into the evening rush hour at four different locations in Manhattan--CNET's offices in Midtown, Columbus Circle, Times Square, and Union Square. To measure download and upload speeds, we downloaded the Ookla's Speedtest.net mobile app (set to the same server and set to measure in kilobits per second) to the iPhone 4 for
Separately, I (Bonnie) went around the same locations over the weekend, as well as other reported trouble spots, including the Upper West Side, Upper East Side, and Greenwich Village, and made phone calls to one annoyed little brother. I used the
Finally, for a more comprehensive and detailed look at the service in your area, including average signal strength, data throughput, and dropped calls, be sure to check out our Root Wireless carrier coverage map and don't forget to help us rate carrier coverage by contributing your own data.
All measuresments are in kilobits per second
| Download | Upload | |
| AT&T | Average: 1243; Maximum:1412 | Average: 43; Maximum: 95 |
| Sprint | Average: 104; Maximum: 167 | Average: 295; Maximum: 805 |
| T-Mobile | Average: 157; Maximum: 168 | Average: 128; Maximum: 145 |
| Verizon | Average: 123; Maximum: 131 | Average: 281; Maximum: 425 |
Columbus Circle
| Download | Upload | |
| AT&T | Average: 1683; Maximum: 1822 | Average: 96; Maximum: 96 |
| Sprint | Average: 601; Maximum: 621 | Average: 164; Maximum: 352 |
| T-Mobile | Average: 2021; Maximum: 2260 | Average: 1315; Maximum: 1321 |
| Verizon | Average: 1491; Maximum: 1944 | Average: 910; Maximum: 969 |
Times Square
| Download | Upload | |
| AT&T | Average: 302; Maximum: 409 | Average: 46; Maximum: 49 |
| Sprint | Average: 947; Maximum: 1524 | Average: 365; Maximum: 416 |
| T-Mobile | Average: 1247; Maximum: 1962 | Average: 1259; Maximum: 1315 |
| Verizon | Average: 182; Maximum: 270 | Average: 983; Maximum: 1231 |
Union Square
| Download | Upload | |
| AT&T | Average: 952; Maximum: 377 | Average: 41; Maximum: 42 |
| Sprint | Average: 151; Maximum: 250 | Average: 477; Maximum: 844 |
| T-Mobile | Average: 1481; Maximum: 1866 | Average: 1972; Maximum: 3375 |
| Verizon | Average: 182; Maximum: 270 | Average: 983; Maximum: 1231 |