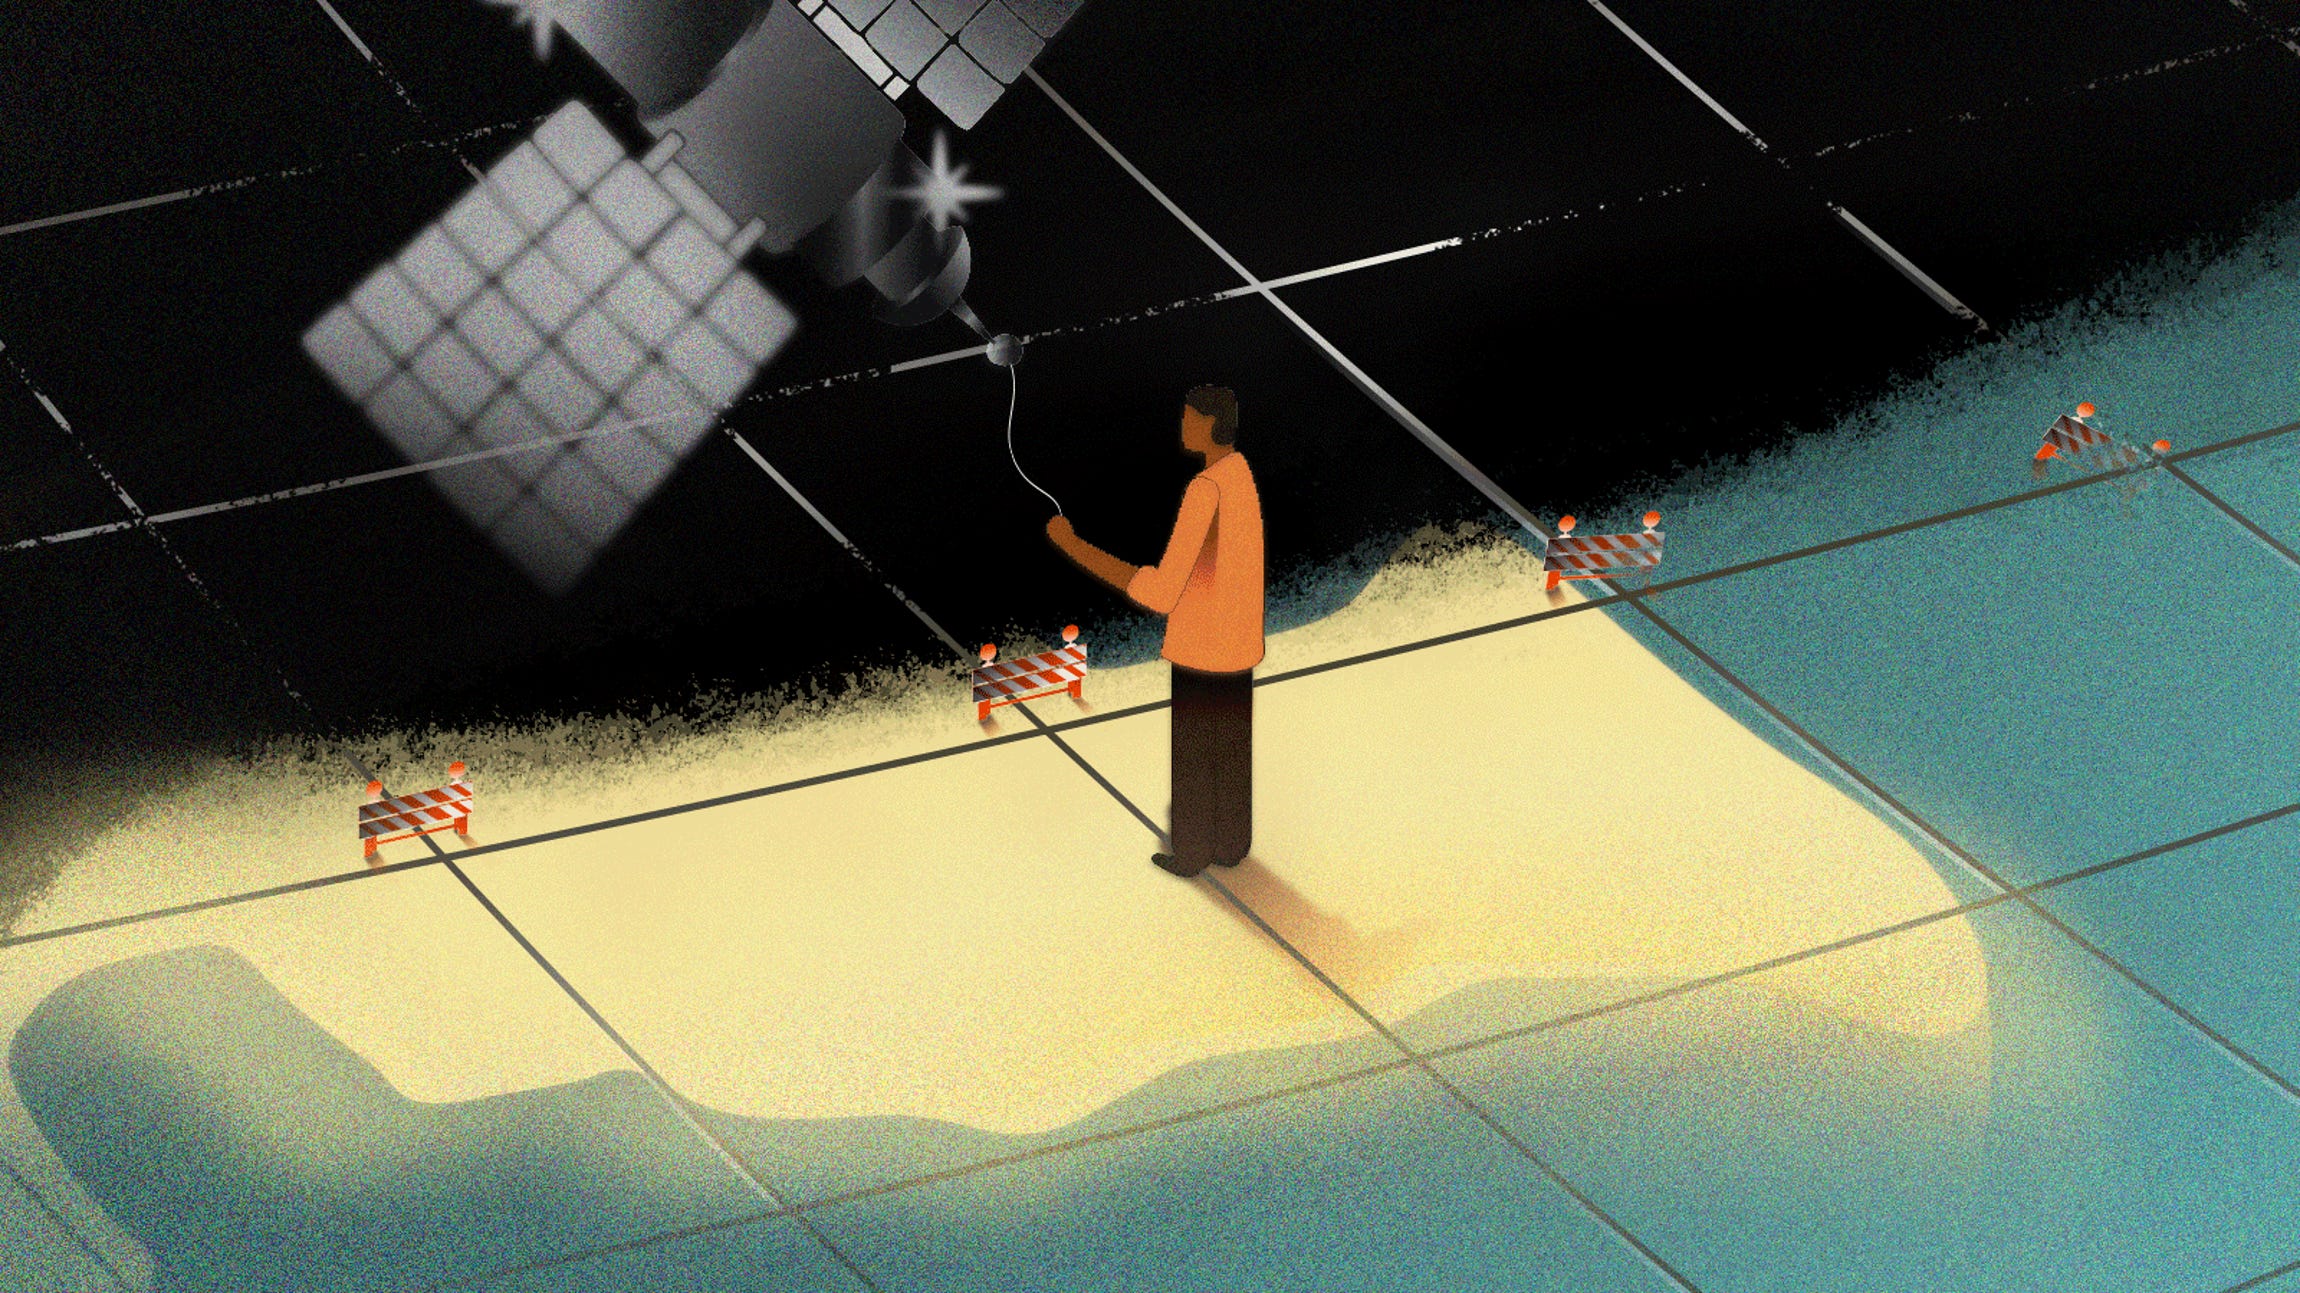
How next-gen satellites are transforming our view of climate change
As more frequent and more severe storms erode coastlines, mapmakers must adapt quickly.


A shrinking swath of coastline in Washington state has a regrettable nickname: Washaway Beach. It's named not for what's there, but rather for what isn't. Insatiable Pacific Ocean currents have taken greedy bites out of the land over the past century.
Washaway Beach's disappearing shore isn't measured in centimeters or inches. You can't track the changes with a hardware store measuring stick. Residents of the area, roughly two and a half hours southwest of Seattle, are watching their homes and businesses get swallowed by the sea at an average rate of 100 feet per year; that's about the height of a 10-story building. It's the fastest-eroding place in the western United States.
Washaway Beach is an extreme case of erosion. Many factors contribute to its rapid decline. But the quickening march of climate change, including rising sea levels and more frequent and severe storms, poses a growing threat to coastal communities everywhere.
I've never been to Washaway Beach. I'm hearing about it for the first time from Peter Doucette, the acting director for the Earth Resources Observation and Science Center at the US Geological Survey. Doucette is showing me over Zoom a colorful animated map of how the community changed between 1985 and 2017. The water eats away at the map's multicolored patches. The brown beaches, red developed areas and light blue freshwater bogs evaporate in the Pacific's 32-year sprint to wipe out the town. It's jarring to watch how quickly the land dissolves into the deep blue as the ocean takes over.
Watch Washaway Beach disappear.
Scientists didn't have the tech to visualize changes like this even five or 10 years ago, though they had the data. "This is the power of using the data from time; it's taking advantage of the time dimension, which requires a lot of computing power ... but we have that now," Doucette explains.
Faster satellites, sharper images taken in near real-time and advanced computing techniques are making it possible for mapmakers to redraw Washaway Beach as soon as coastal changes occur. Emerging technologies will help scientists predict what could happen to it in the future, just like a weather report.
For coastal residents around the world, or anyone living in an area susceptible to extreme weather events, this type of mapping could save lives. Up-to-date maps can provide crucial information for first responders needing to traverse areas hit by natural disasters; residents and visitors need regular, ongoing updates to adapt to a changing landscape.
For anyone living in areas less directly affected by the climate crisis, maps that show change over time provide a crucial bridge to understanding what's really happening in other places, and how quickly.
"By helping people visualize how the world is changing, maybe that will give them a better understanding of climate change as a whole," says Tanya Harrison, director of science strategy at Planet, a private satellite imagery company. "How is your neighborhood being affected? How is your grandmother's house being affected? Maybe she lives on the other side of the country or the other side of the world. In a way, that can kind of make this a little bit more personal."
From clay tablets to satellites
Maps aren't easy to define. They're squishy things, molded by the minds of the people who create them. Imperfect representations of our world. One part art; one part science.
Still, they give us a baseline for decision-making, whether it's finding the closest coffee shop, climbing a mountain or helping people understand something more serious, like climate change.
"[Maps are] such a great intuitive way to gather information and humans are really good at understanding spatial information presented in that way," says Mike Tischler, director of the National Geospatial Program at the US Geological Survey. "You want to know what's over the ridge, you want to know what's around the bend, you want to know where things are." That's probably why maps have been around for thousands of years.
A clay tablet known as the Babylonian Map of the World, or Imago Mundi, is the oldest known map of the world. It was discovered in Iraq and dates back to about 600 B.C.
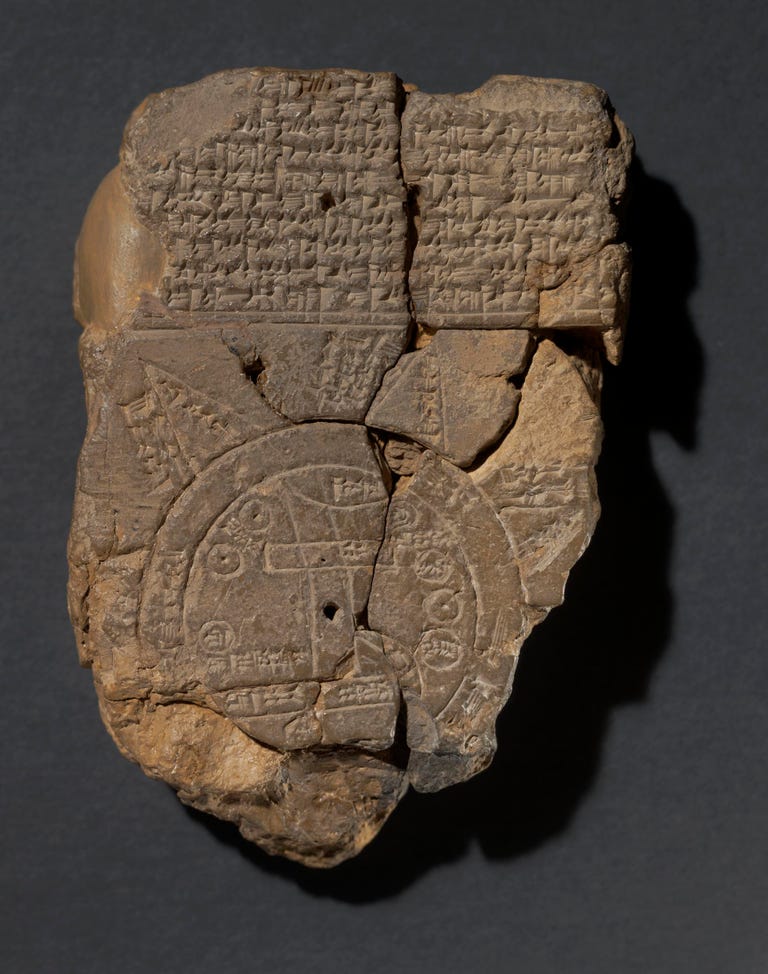
The Babylonian Map of the World is the oldest map of the world.
Modern mapmaking got its start in 1852, when French army officer Aimé Laussedat created the first maps with photographs. Laussedat also experimented with aerial photography, sticking cameras on kites and balloons. As air travel became more sophisticated, aerial photography transitioned from balloons to planes in World War I and World War II and, eventually, to satellites in the 1970s.
Nowadays, aerial photography is more automated than it was when ground crews launched unsteady balloons into the air, hoping to get the right shots. Hundreds or thousands of images are taken automatically from planes and satellites to make maps. Now planes and satellites visit the same place regularly, reliably showing how land changes over time.
"Land change is really complex. ... Tying it to climate, I'm not sure we're there yet," says Jesslyn Brown, research geographer for the Earth Resources Observation and Science Center at the US Geological Survey. You can't identify patterns that could point to climate change without monitoring the same places at regular intervals.
"This might be a little controversial, but my opinion is that governments don't find monitoring very sexy," Brown says. "But it's an absolute necessity because you can't manage what you can't measure, so we need to take these measurements in order to have the information to monitor the Earth and to monitor the effects of climate change."
Chasing change
In the US, Landsat is the best-known Earth-observing satellite for monitoring and mapping purposes. Landsat 7 and Landsat 8 circle the globe once every 99 minutes, traveling at 17,000 miles per hour. Each satellite covers the entire planet in 16 days. Together, they cover the Earth in eight days because they're in reverse orbit.
The satellites are "roughly the size of a small school bus," says Doucette, the USGS director who showed me the map of Washaway Beach, and have a 30-meter resolution, "about the size of a baseball diamond per pixel."
Generations of Landsat satellites have been doing this since 1972. That 50-year record makes it extremely valuable for tracking changes over time.
"[50 years of data] provides researchers the ability to go back through time and monitor what kinds of changes are going on on the land surface," Doucette says. "That really wasn't possible until just the last five to 10 years with the big data compute capabilities that have become available."
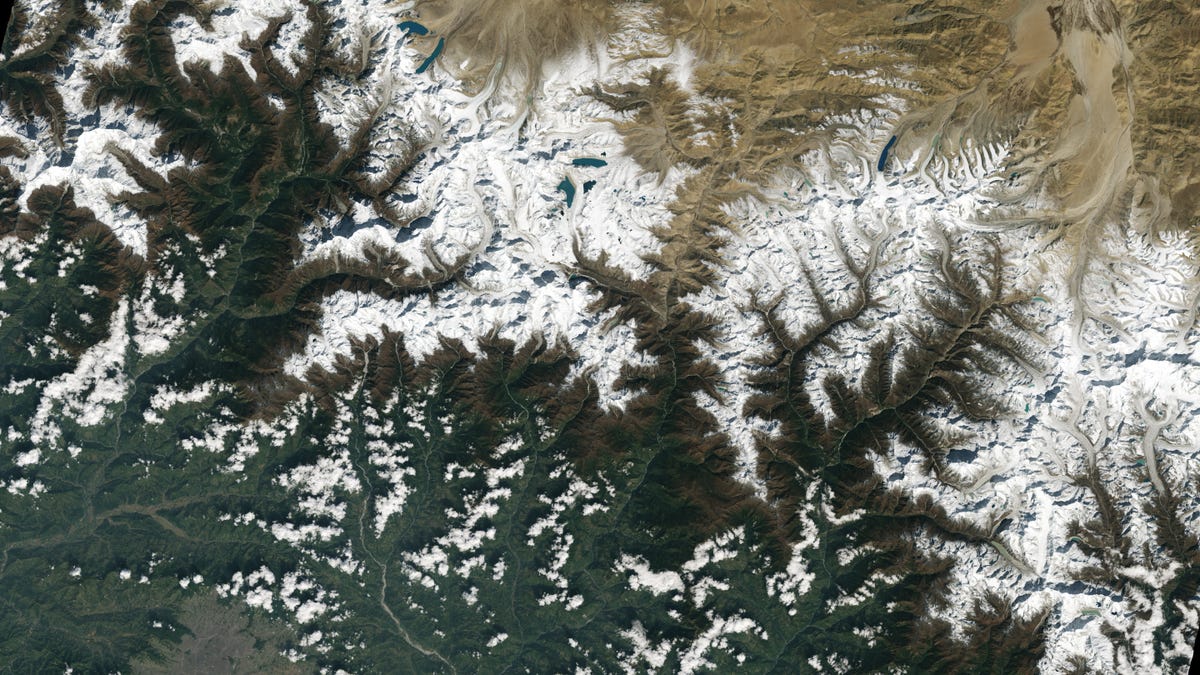
This image of the Himalayan Mountains is one of the first shots taken by Landsat 9.
NASA launched its newest satellite, Landsat 9, on Sept. 27. Soon, it will hand over control of Landsat 9 to the USGS. Then, Landsat 7, which has been orbiting the planet for 22 years, will be retired. Most old Landsat satellites go into "disposal orbits," destined to circle the planet until they eventually reenter the atmosphere and burn up. Landsat 7 won't have the same fate; it will be moved into a different orbit to help test NASA's robotic refueling project, Doucette explains.
Landsat is still the gold standard for satellite imagery, says Terry Sohl, acting branch chief for the Integrated Science and Applications Branch and research scientist at the USGS Earth Resources Observation and Science Center. "To be honest, I'm not sure that's going to be the case in five years," Sohl adds.
Private satellite companies are making it easier than ever to visualize changes worldwide almost as soon as they happen for much less money than Landsat.
Smaller, faster, cheaper, sharper
"If you've got a satellite right now that covers the Earth every two weeks, you can have homes and cities destroyed in that time," says Tischler, the USGS director of the National Geospatial Program. Private companies are sending larger numbers of tiny satellites into orbit that cost less to build, launch and operate, have very high-resolution cameras and cover more ground more quickly.
One of the private companies, Planet, has two different types of satellites: Dove and Sky satellites. The 180 Dove satellites are the size of a loaf of bread; they orbit the globe every 90 minutes and have a three- to five-meter resolution, or about 10 to 16 feet.
Fifteen of the Sky satellites orbit at the poles like the Dove satellites. The remaining six Sky satellites orbit at latitudes closer to where people live to capture images of cities. Combined, the Sky satellites orbit Earth 12 times per day. Sky satellites are about the size of a dishwasher and have a resolution of just 50 centimeters, or a little over a foot and a half. They capture details that Landsat's baseball-diamond-size resolutions can't.
Planet satellites show the Milne Ice Shelf breaking apart in July 2020.
Smaller satellites are cheaper, too. It costs about a billion dollars to design, build, test and deploy one Landsat satellite. One Planet satellite costs in the "low hundreds of thousands of dollars," although the company wouldn't say exactly how much.
Having a lot of smaller satellites also makes it easier for the San Francisco-based team to build them locally and experiment with new technologies quickly.
"If there's something new that comes to the market that could lead to better image quality ... we have the option to just switch that out in-house where we're actually building the satellites in the basement of our headquarters in San Francisco and just say, 'Hey, let's put in a new sensor. Let's launch that,'" says Harrison, Planet's director of science strategy.
That way, if they want to test something, they can try it on one satellite and see how it works, without having to update all 200 satellites in their fleet.
Its various satellites have observed many events related to the climate crisis all over the world. The most significant changes they've seen have taken place in the coldest regions.
In July 2020, Planet satellites captured the collapse of the last intact Arctic ice shelf. "That was obviously a big tragedy. It's not the kind of thing that you want to see, but it's something that we managed to capture," Harrison says.
Seeing is believing
Newer satellites are giving us more data, more quickly. Advancements in computing are changing how mapmakers use that data to show how our planet is changing right now and how it could change in the future.
Doucette is showing me another map now, this time a projection of what the land near Lubbock, Texas, will look like decades from now. At some point, the Ogallala Aquifer, which supports cotton and other key crops in the region, is going to dry up. Scientists at the USGS worked with other government agencies to create forecasts of Lubbock between 2014 and the end of the century, drawing from Landsat data, socio-economic data and climate data.
The map shows the cotton crop disappearing in tandem with the Ogallala's water. The projections will vary based on how water usage continues, so scientists create best, middle and worst case scenarios because of the uncertainty.
"Climate is actually much more predictable than people. I don't worry about the variability in a climate scenario; I worry about the variability of how people behave," says Sohl, the USGS scientist. "There are all these things that happen that are just so totally unpredictable, like a new government policy that can have a huge impact on the landscape."
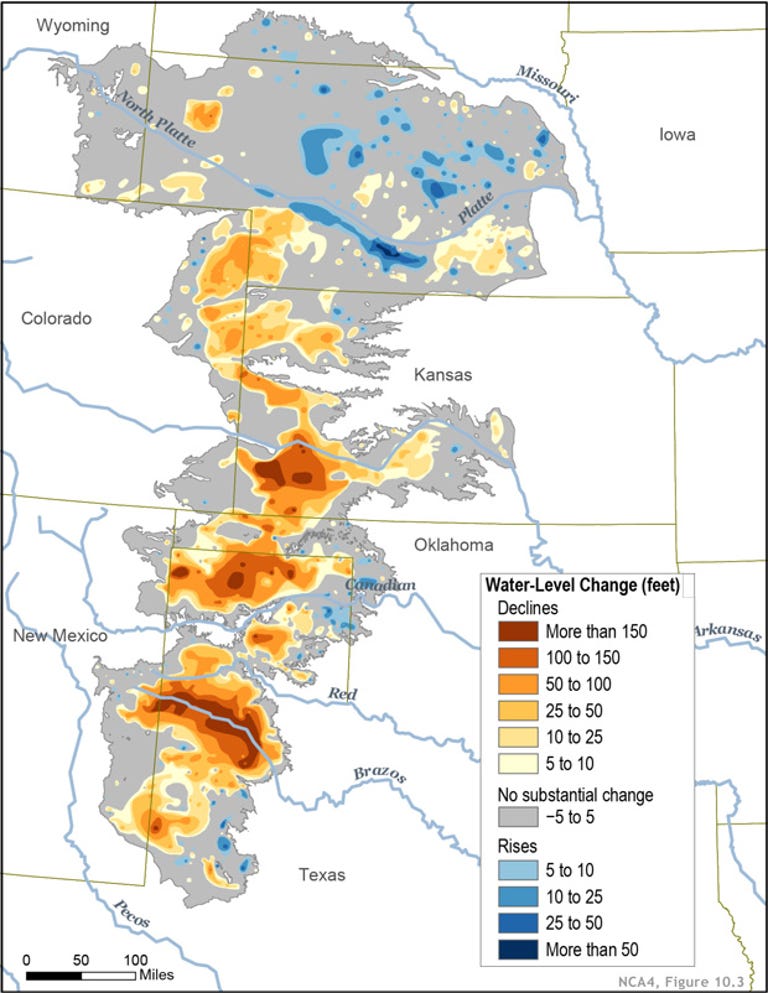

What happens when the Ogallala Aquifer runs out of water?
Either way, the Ogallala's water will disappear and it isn't coming back.
Knowing this in advance gives people in Lubbock time to shift to other types of crops that don't depend so heavily on water. Doucette suggests dryland wheat or returning the area to grassland.
"This is how we hope to use Landsat and other related Earth observation data so we can understand the causes of change in the past that kind of help us develop these models for projecting potential change going into the future," Doucette says.
Historic data from Landsat combined with sharper-resolution imagery from private satellite companies equips mapmakers to show climate change impacts now and model what could happen to the same areas decades or even centuries from now. "[Landsat and private satellite companies] really [are] a nice mix of where we're going in the future," says Sohl.
As Washaway Beach's erosion cuts further into inland Washington state, the freshwater cranberry bogs the area is known for are increasingly threatened with contamination from salt water. But with these technologies, scientists can look at the models and make decisions before Washaway Beach, the Ogallala Aquifer and other places like them fall off the map.
"Imagine being able to do this kind of projection ... and doing it on a national scale or even a global scale," Doucette adds. "That's our hope; this is still kind of cutting-edge research."