The wild activity of our magnificent sun
The solar maximum is nearly in full swing, and the solar system has been in a hullabaloo from the sun's activity.


Three years of the sun
The solar maximum is nearly in full swing, and the solar system has been in a hullabaloo from the sun's activity.
As we've mentioned before, the solar maximum will have a few effects here on earth. You're probably most likely to notice interruptions to radio and navigation devices (so if you get lost, you can quite rightly tell people that it's the fault of a disaster). Generally, though, the effects are quite benign and, if you're lucky, you'll get to catch the most visually amazing phenomenon of which our sky is capable.
Meanwhile, NASA's Solar Dynamics Observatory (SDO) has been compiling some amazing images of solar activity. If you want to get a better idea of what's going on with the old treacle bun, have a click through the gallery below to see what a solar maximum actually entails.
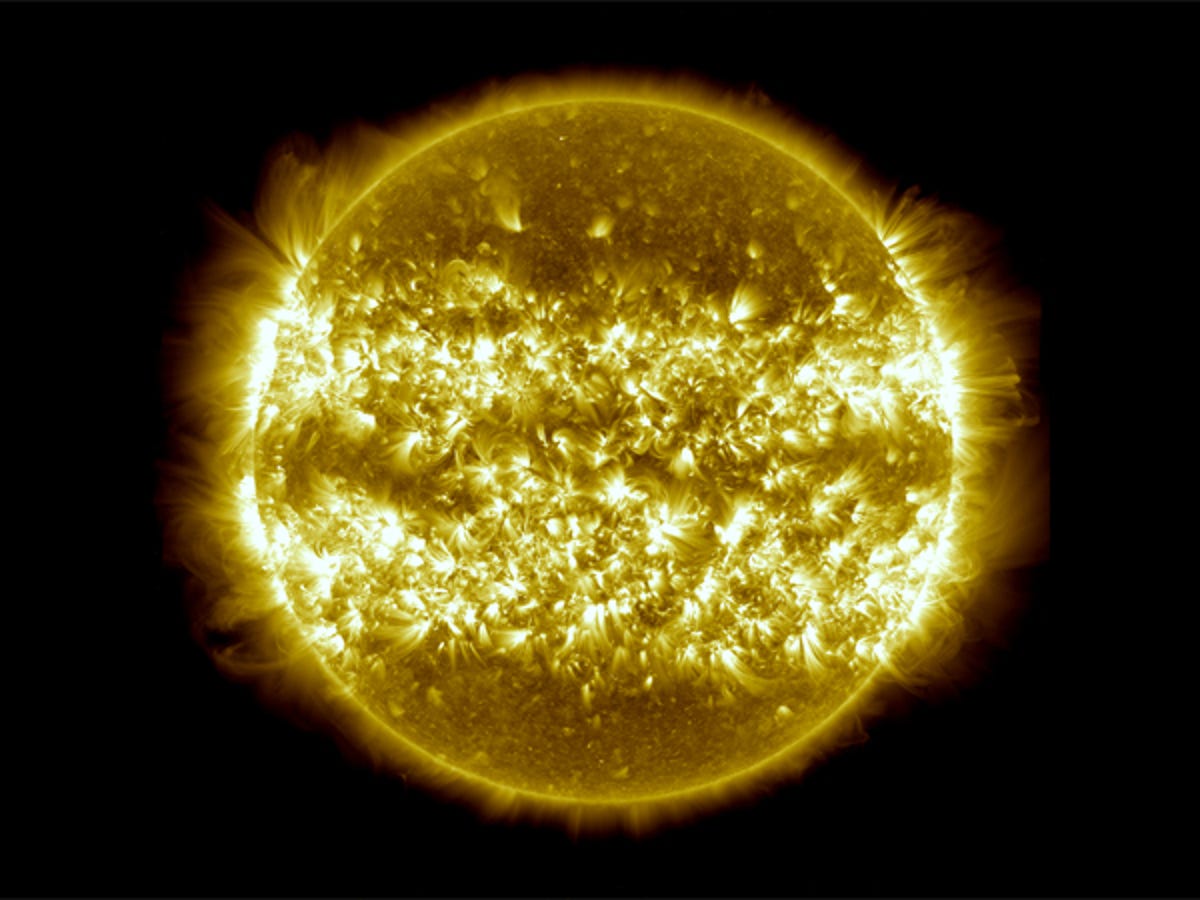
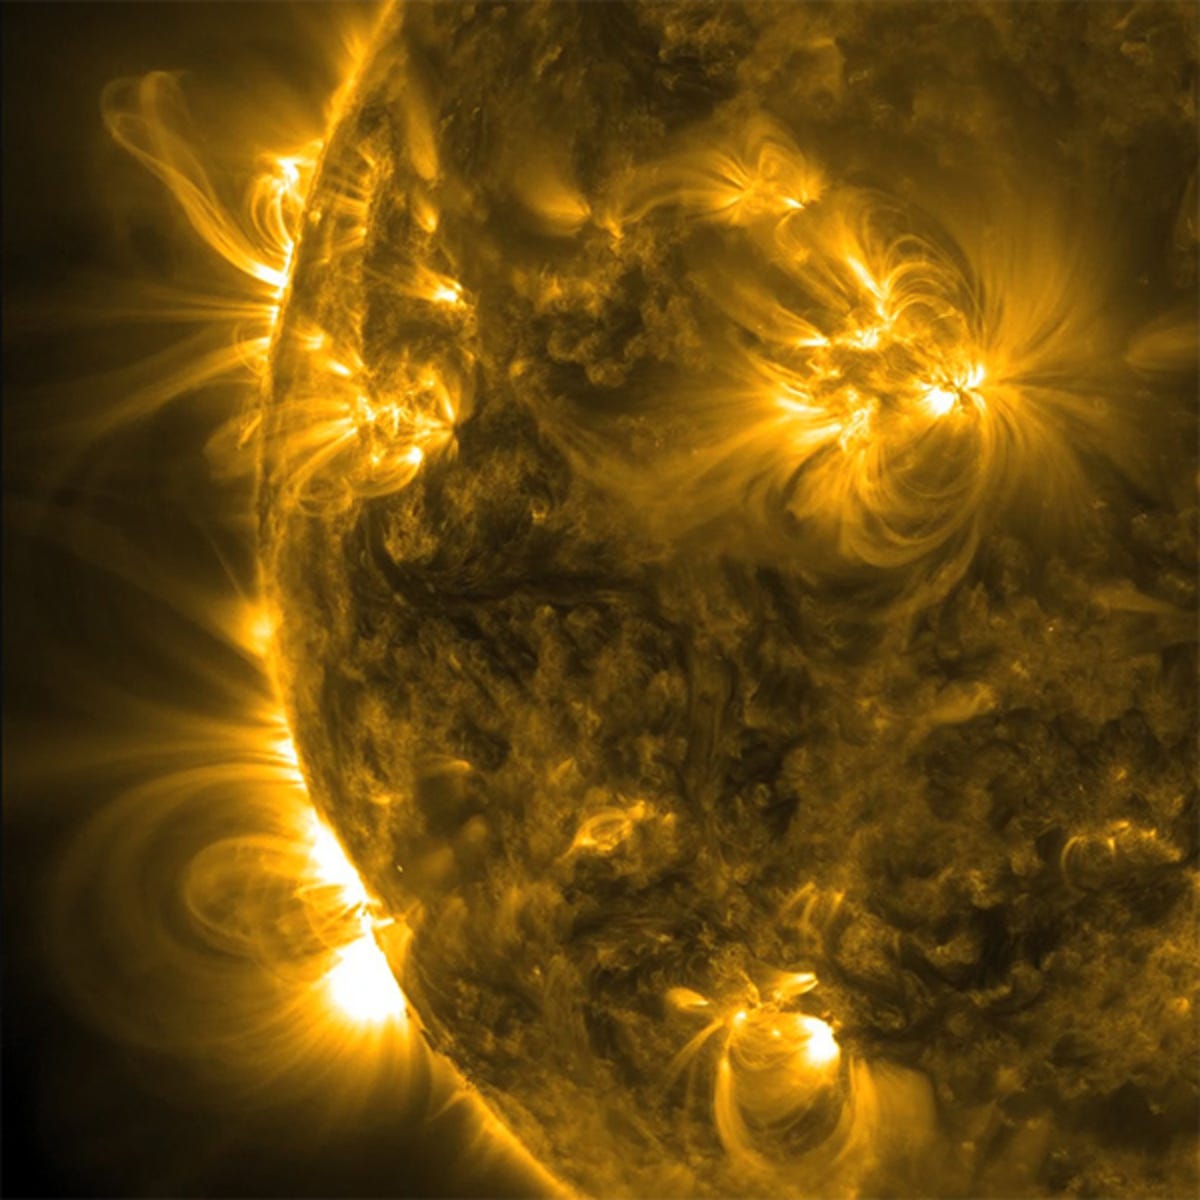
NASA's SDO sent back its very first images in early 2010 and since then, has been sending images back to Earth daily, taking a photo every 12 seconds in 10 different wavelengths. The image above comprises 25 separate images between 16 April 2012 and 15 April 2013, showing the parts of the sun most active during the year as the sun builds up to the 2013 solar maximum at a wavelength of 171 angstroms in the extreme ultraviolet range. In the video below, you can see the entire three years in three minutes at a rate of two photos a day — starting quiet, then building to a peak.
Solar flare filmed in stunning HD
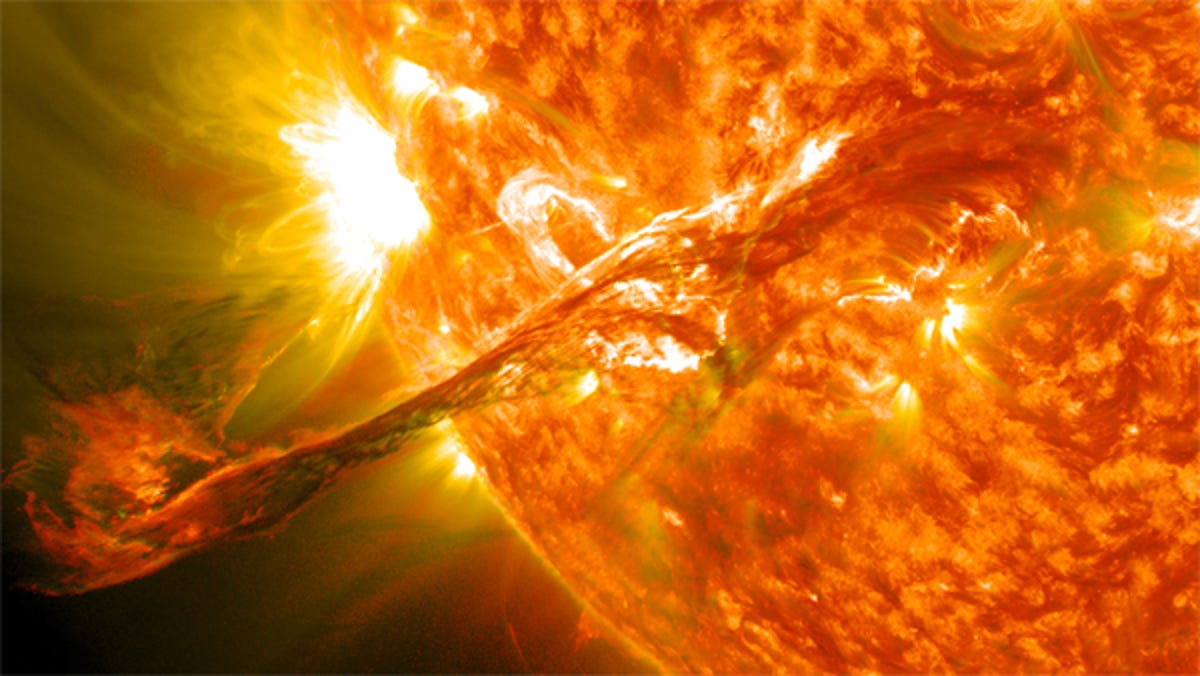
On 31 August last year, a long filament of solar material erupted from the surface of the sun at a speed of around 1450 kilometres per second. Although it didn't erupt towards the earth, it was responsible for a gorgeous aurora display over Canada. NASA managed to capture the eruption in full 1080p HD from a variety of angles, which you can see in the video below.
First light
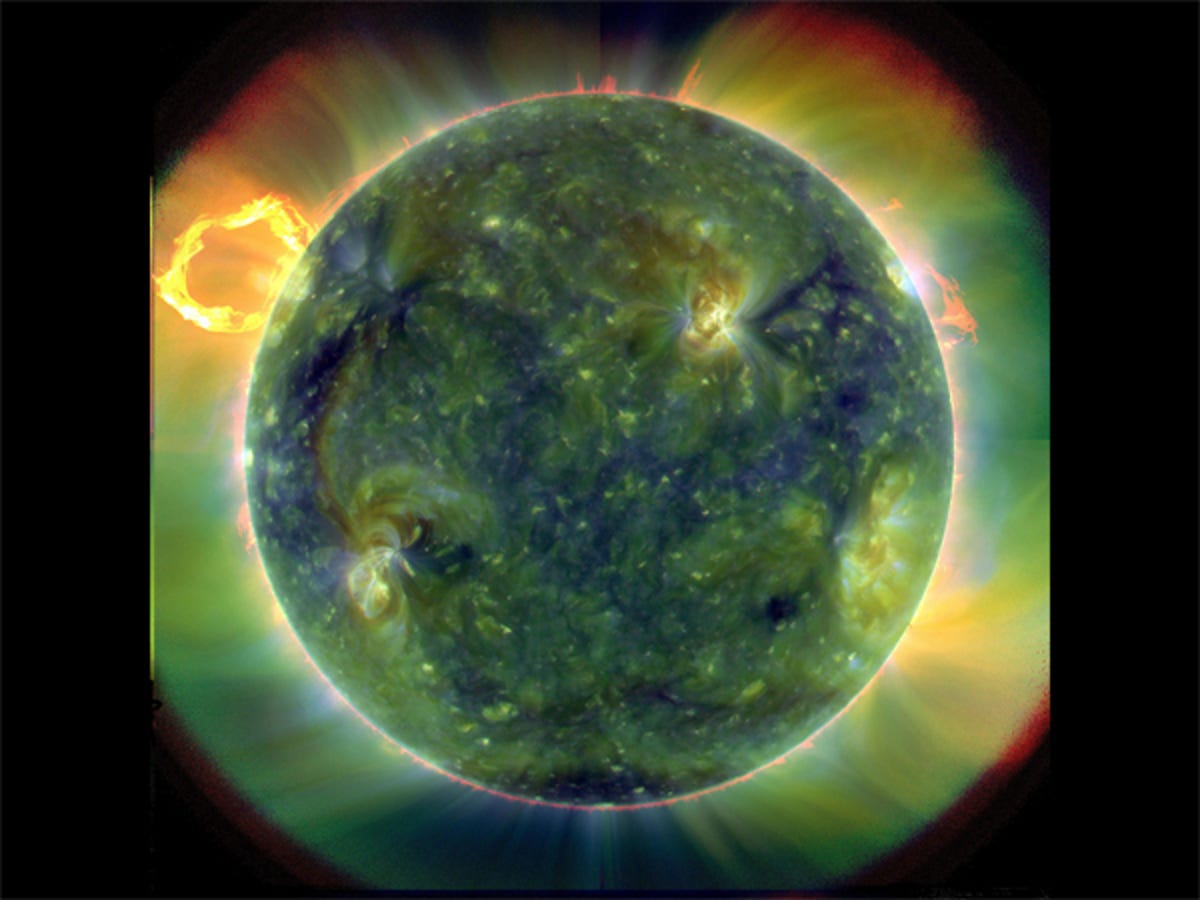
One of the very first images sent back to Earth from the SDO, this image, taken on 30 March 2010, has captured the sun in multiple wavelengths in false colour to show the temperature variations across the surface of the sun. Reds are the coolest, at around 60,000 degrees Celsius, with blues and greens higher than one million degrees Celsius. In the top left corner, a coronal mass ejection (CME) is seen erupting.
The biggest flares of 2013
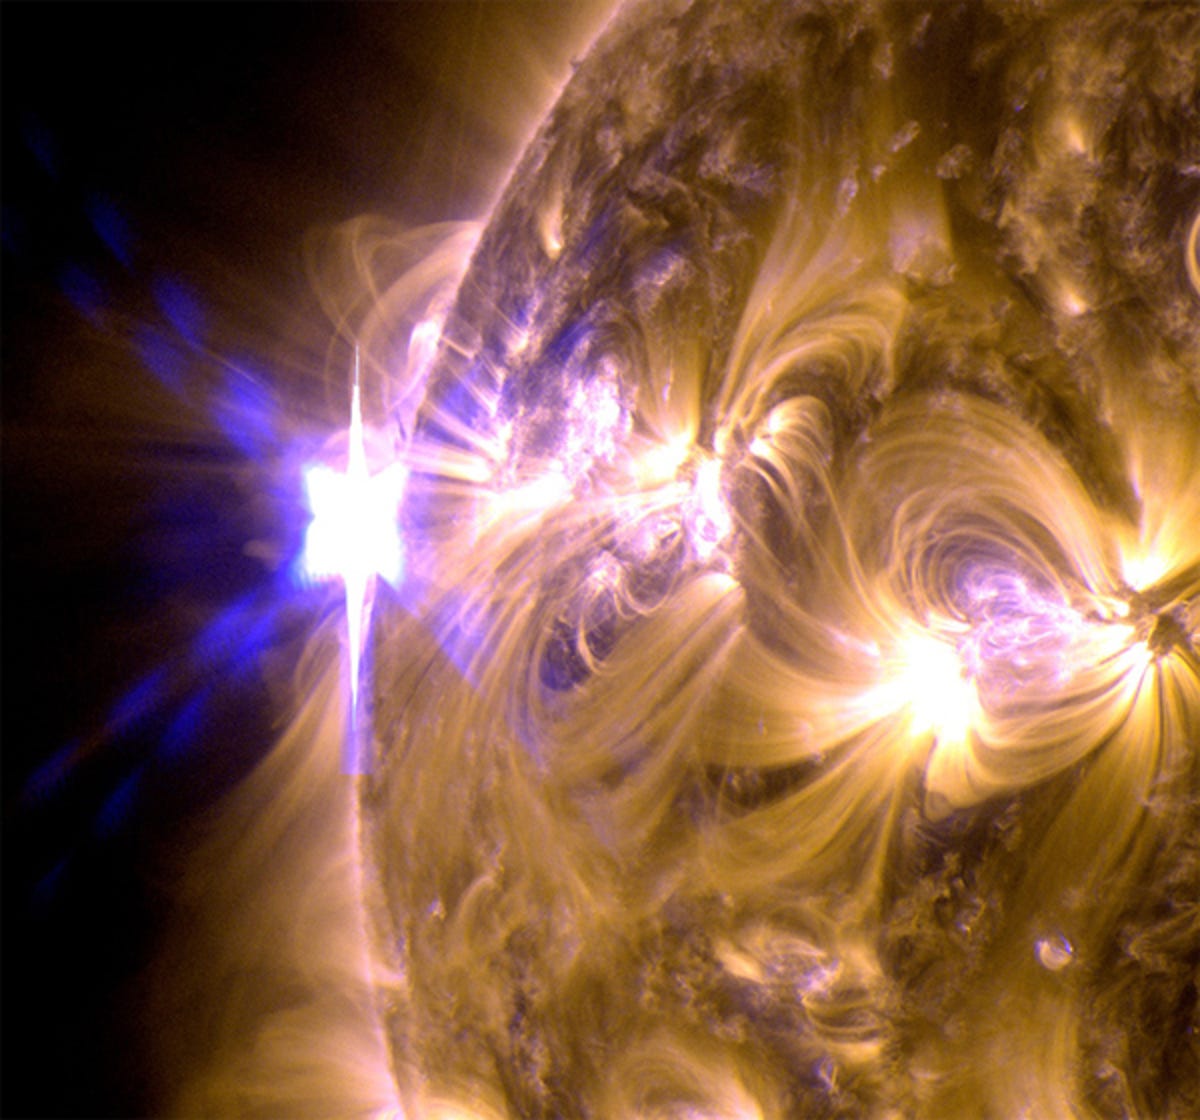
From 12-13 May, the sun erupted the three biggest flares yet seen in 2013. The three flares were X-class, the most powerful flares of which the sun is capable, and caused a high-frequency radio blackout. The first flare, at a magnitude of X1.7, peaked at midnight, followed by an X2.8 flare 14 hours later. The third was nine hours later again, and was the most powerful of the three at X3.2. All three occurred within the space of 24 hours. The images above and below show the X1.7 flare in a 171-angstrom wavelength and a 131-angstrom wavelength.

(Credit: NASA/SDO/AIA)
Magnetic fields
From 13-17 October last year, the SDO captured at 171 angstroms the looping magnetic fields over the active regions of the sun.
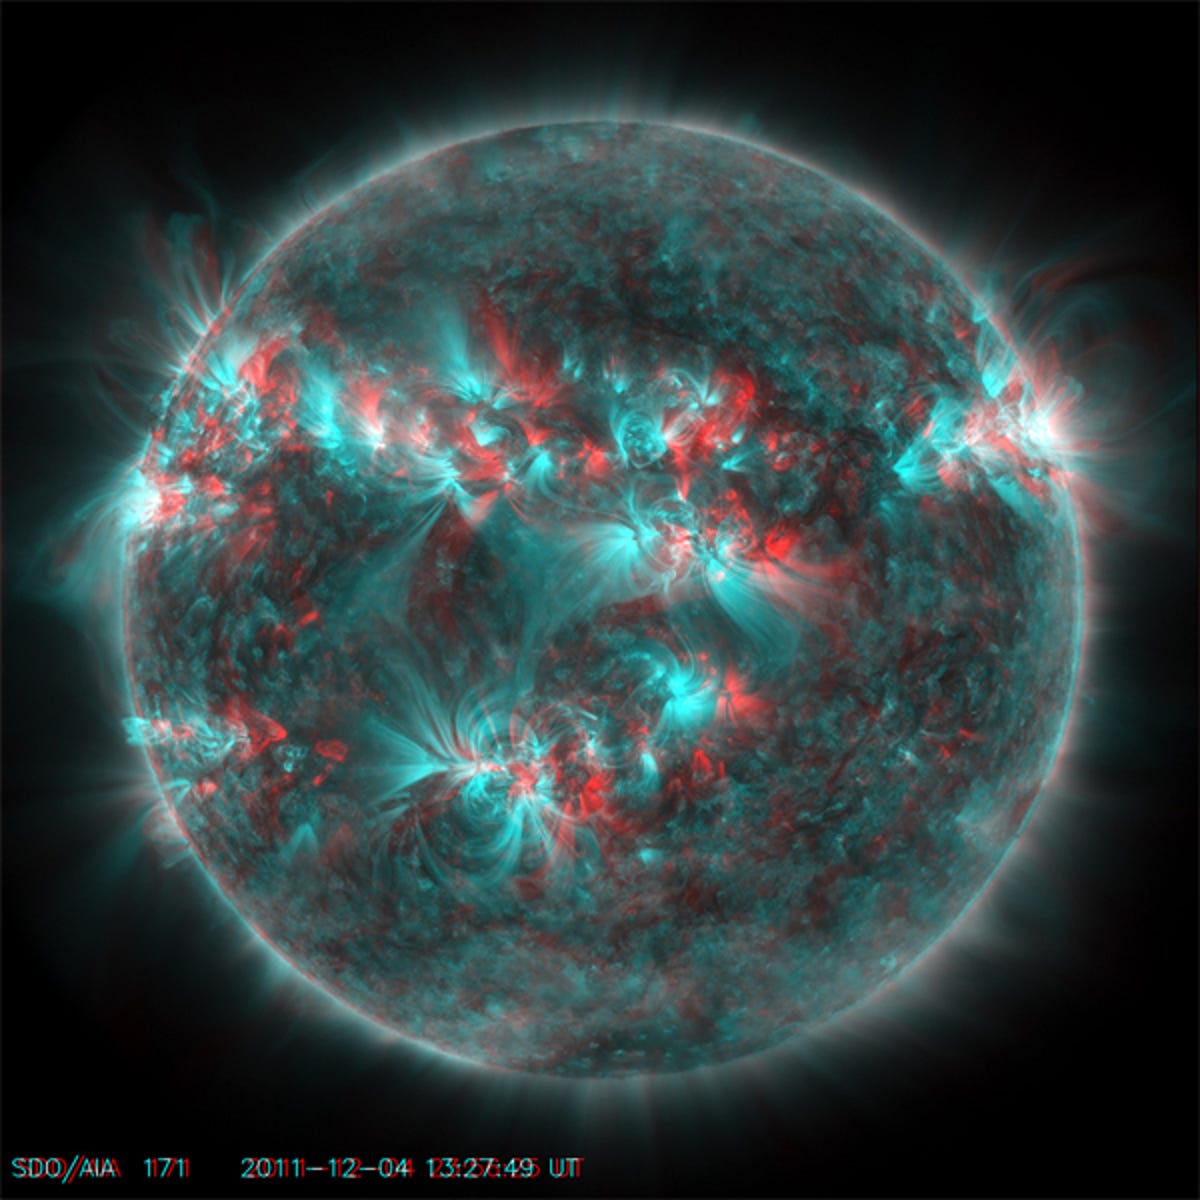
Solar activity in 3D
Crack out the anaglyph glasses and get ready to see the sun in three crazy dimensions! This image is made up of a pair of high-resolution images from 4 December 2011, taken 10 hours apart. The rotation of the sun creates enough perspective so that the images can be converted into anaglyph 3D.
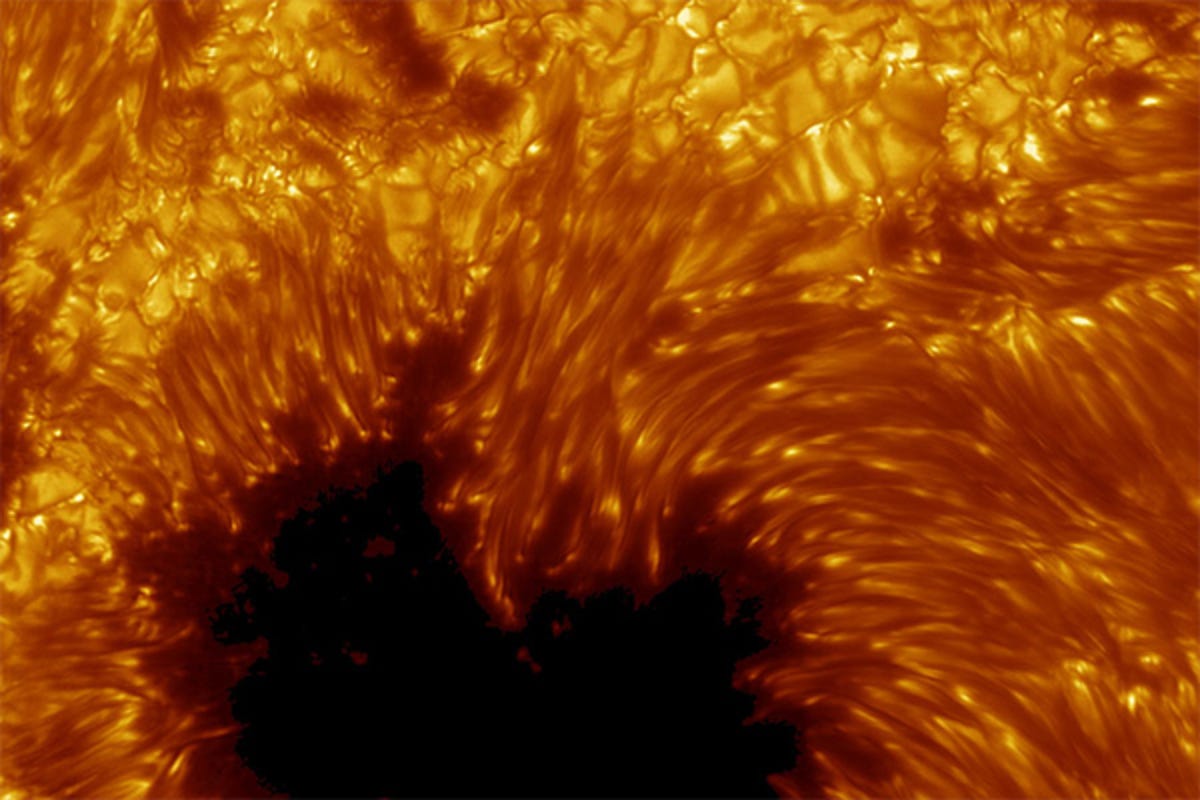
Even the sun gets spots
This image, captured in 2002 by the Swedish Solar Telescope on the Canary Island of La Palma, is one of the sharpest images of the sun ever taken. It shows a sunspot and the activity around it of boiling plasma. They are caused by patches of high magnetic activity and are partially characterised by a lower temperature. This means they produce less light than the surrounding areas, making them appear dark in comparison. Sunspots also typically appear in pairs as opposing magnetic poles.
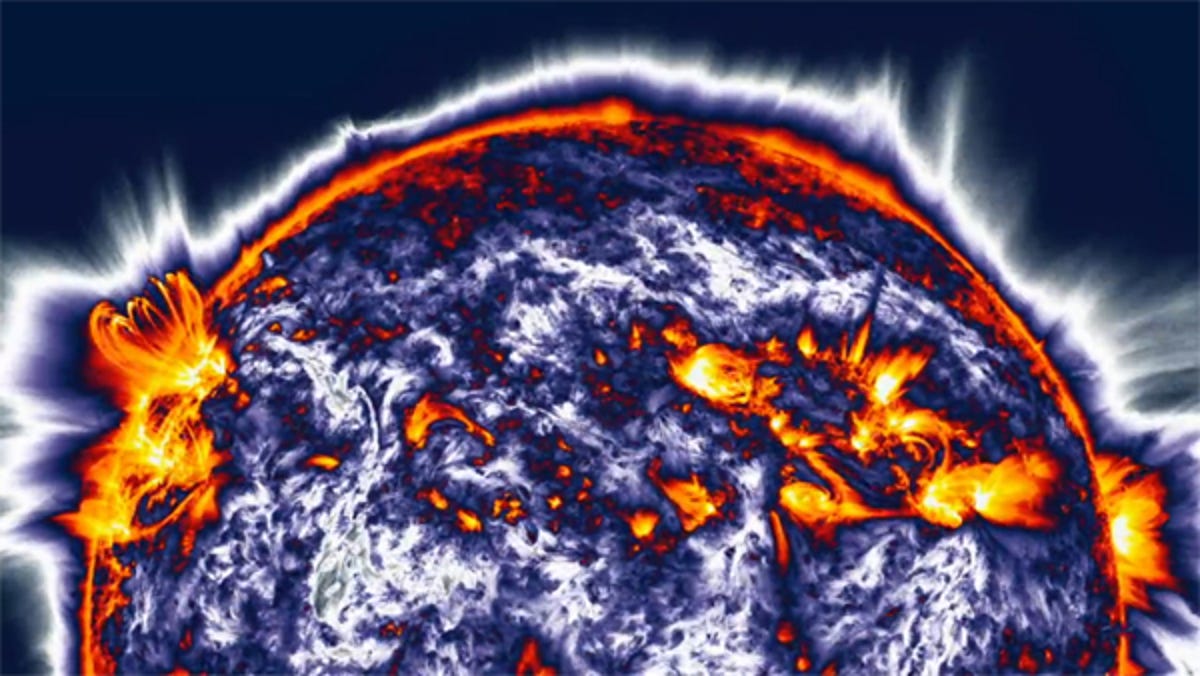
The sun in gradient
With a gradient filter applied, the sun looks incredible — but NASA doesn't just apply gradients to make the sun look pretty. The effect enhances areas of contrast so that scientists can get a clearer view of structures that might otherwise remain undefined. In the image above and video below, you can see how the gradient gives definition to coronal loops.
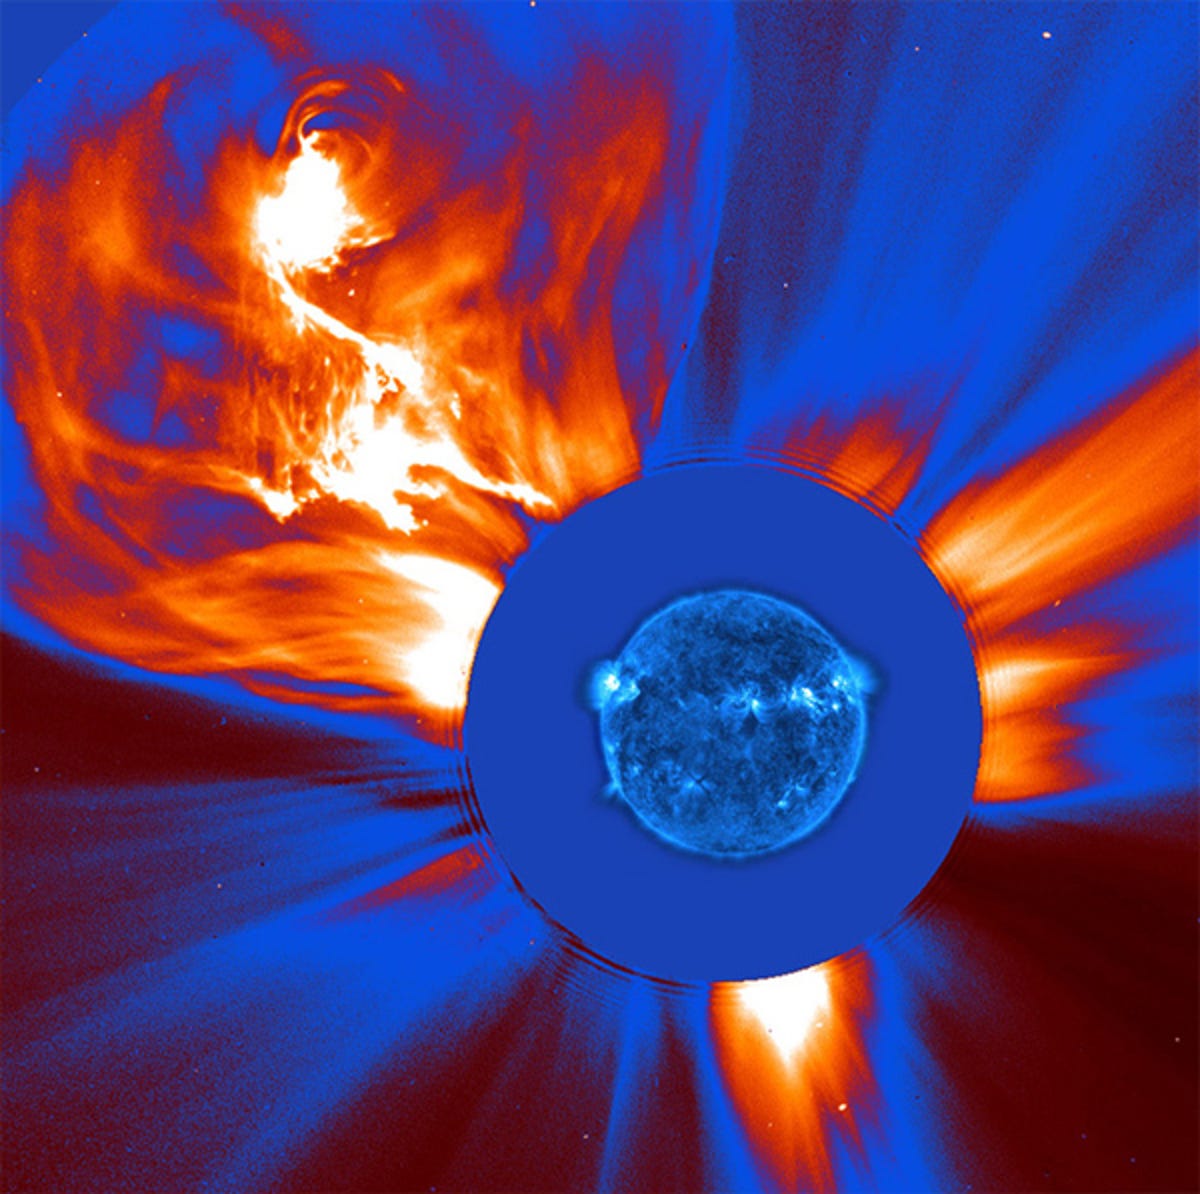
CME composite
A particularly large and complex CME captured on 4 January 2002. This image, showing particles blasting into the corona, is a composite of two different shots of the event. The white areas show the highest concentration of particles, with red and blue showing lower concentrations respectively. An extreme ultraviolet image of the sun in blue was overlaid on the occulting disc to give the picture a sense of scale.
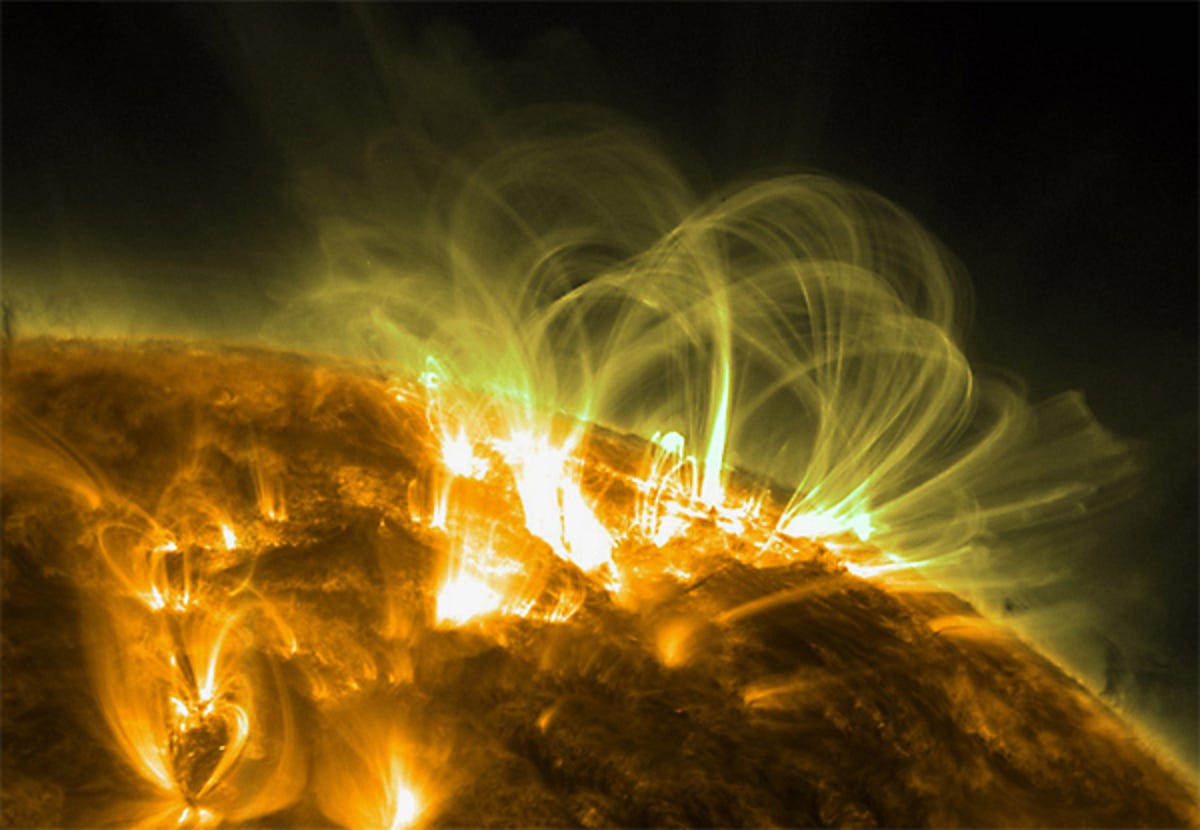
Magnetic loops
Magnetic loops dance across the surface of the sun, emerging from beneath the surface. These coronal loops are formed when the magnetic activity inside the sun bursts through the surface, often with sunspots as a base.
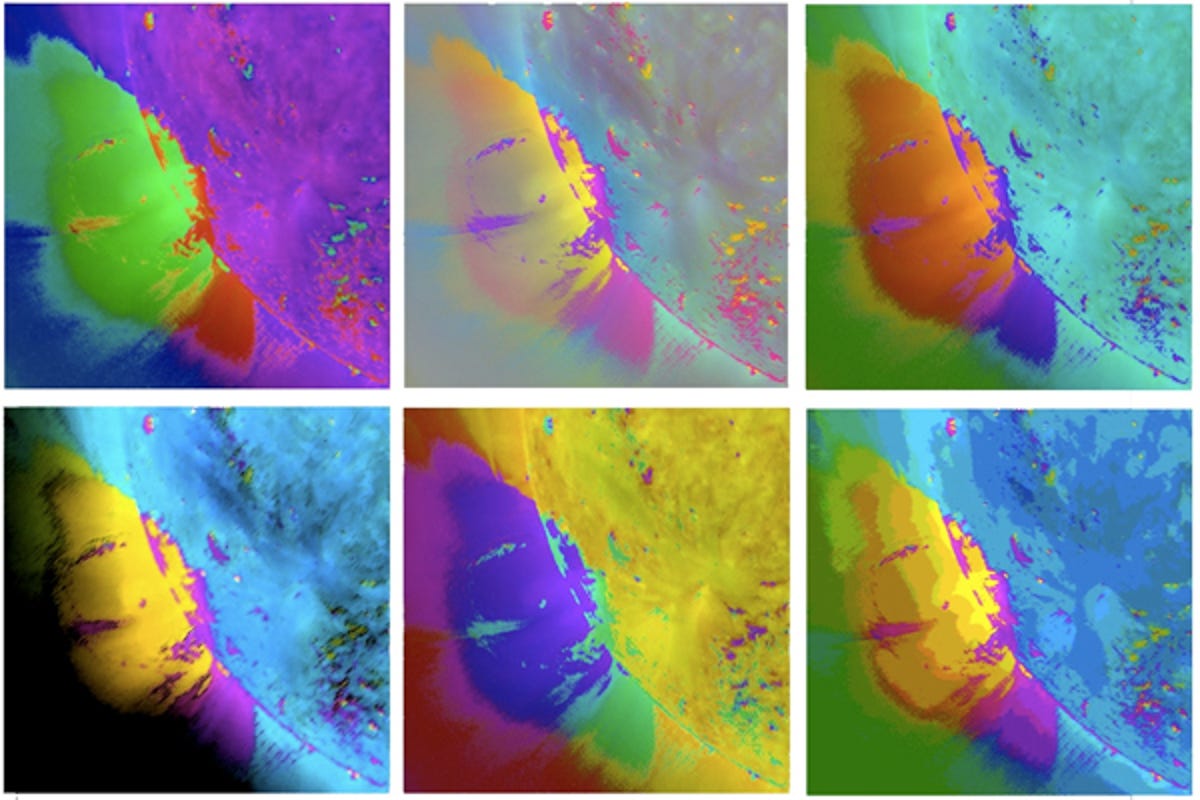
Solar modernist
With different colour tables applied so that scientists can examine solar phenomenon, this image of the sun looks like something that might have appeared in Andy Warhol's oeuvre.
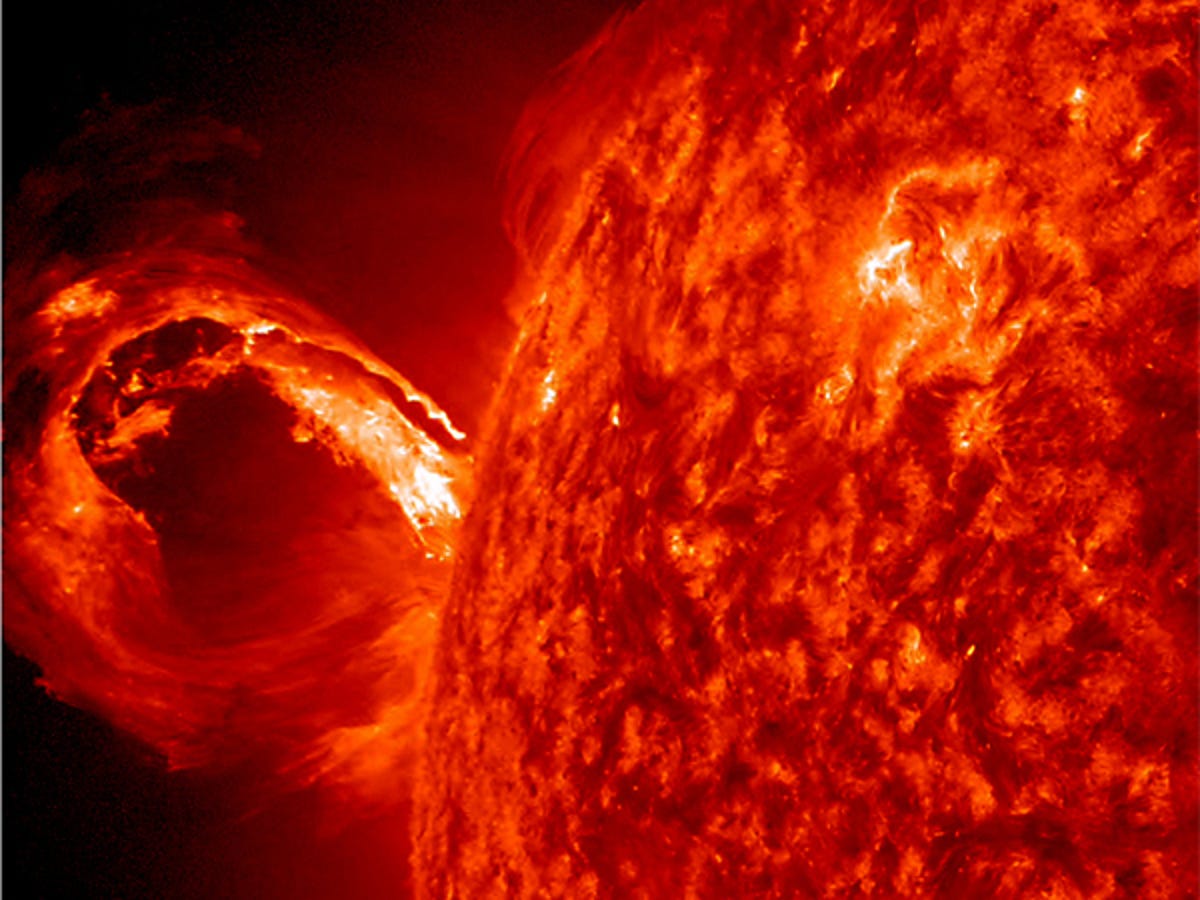
The size of a solar flare
A massive solar flare on 1 May was captured by NASA's entire fleet of heliophysics satellites. Most solar flare photos we've seen are from pretty close to the sun; in the video below, you can see exactly how far a solar flare can reach — and yet this was only a mid-level solar event.
More Galleries
My Favorite Shots From the Galaxy S24 Ultra's Camera
20 Photos
Honor's Magic V2 Foldable Is Lighter Than Samsung's Galaxy S24 Ultra
10 Photos
The Samsung Galaxy S24 and S24 Plus Looks Sweet in Aluminum
23 Photos
Samsung's Galaxy S24 Ultra Now Has a Titanium Design
23 Photos
I Took 600+ Photos With the iPhone 15 Pro and Pro Max. Look at My Favorites
34 Photos