Satellite reveals major loss of Arctic sea ice (pictures)
New measurements from the European Space Agency's CryoSat ice mission show that the volume of Arctic sea ice is declining drastically.
James Martin
James Martin is the Managing Editor of Photography at CNET.
His photos capture technology's impact on society - from the widening wealth gap in San Francisco, to the European refugee crisis and Rwanda's efforts to improve health care.
From the technology pioneers of Google and Facebook, photographing Apple's Steve Jobs and Tim Cook, Facebook's Mark Zuckerberg and Google's Sundar Pichai, to the most groundbreaking launches at Apple and NASA, his is a dream job for any documentary photography and journalist with a love for technology.
Exhibited widely, syndicated and reprinted thousands of times over the years, James follows the people and places behind the technology changing our world, bringing their stories and ideas to life.
Using new data from the European Space Agency's CryoSat satellite spanning 10 years, an international team of scientists has discovered an alarming rate of loss for the Arctic sea ice. Satellites whose mission is to closely watch variations in the coverage and thickness of polar ice show the volume of Arctic sea ice declined an astounding 36 percent during autumn and 9 percent during winter between 2003 and 2012.
The past six years have seen the lowest summer ice extent in three decades, according to the international team of scientists led by University College London, reaching the lowest levels last September at about 3.61 million square kilometers.
To measure the volume of Arctic ice, CryoSat's radar altimeter beams pulses of microwave energy towards the ice, bouncing waves off both the top sections of ice and through the cracks to the water below. The difference in height between these two surfaces allows scientists to calculate the "freeboard" -- the height of ice above the water -- and, as a result, the volume of the ice coverage.
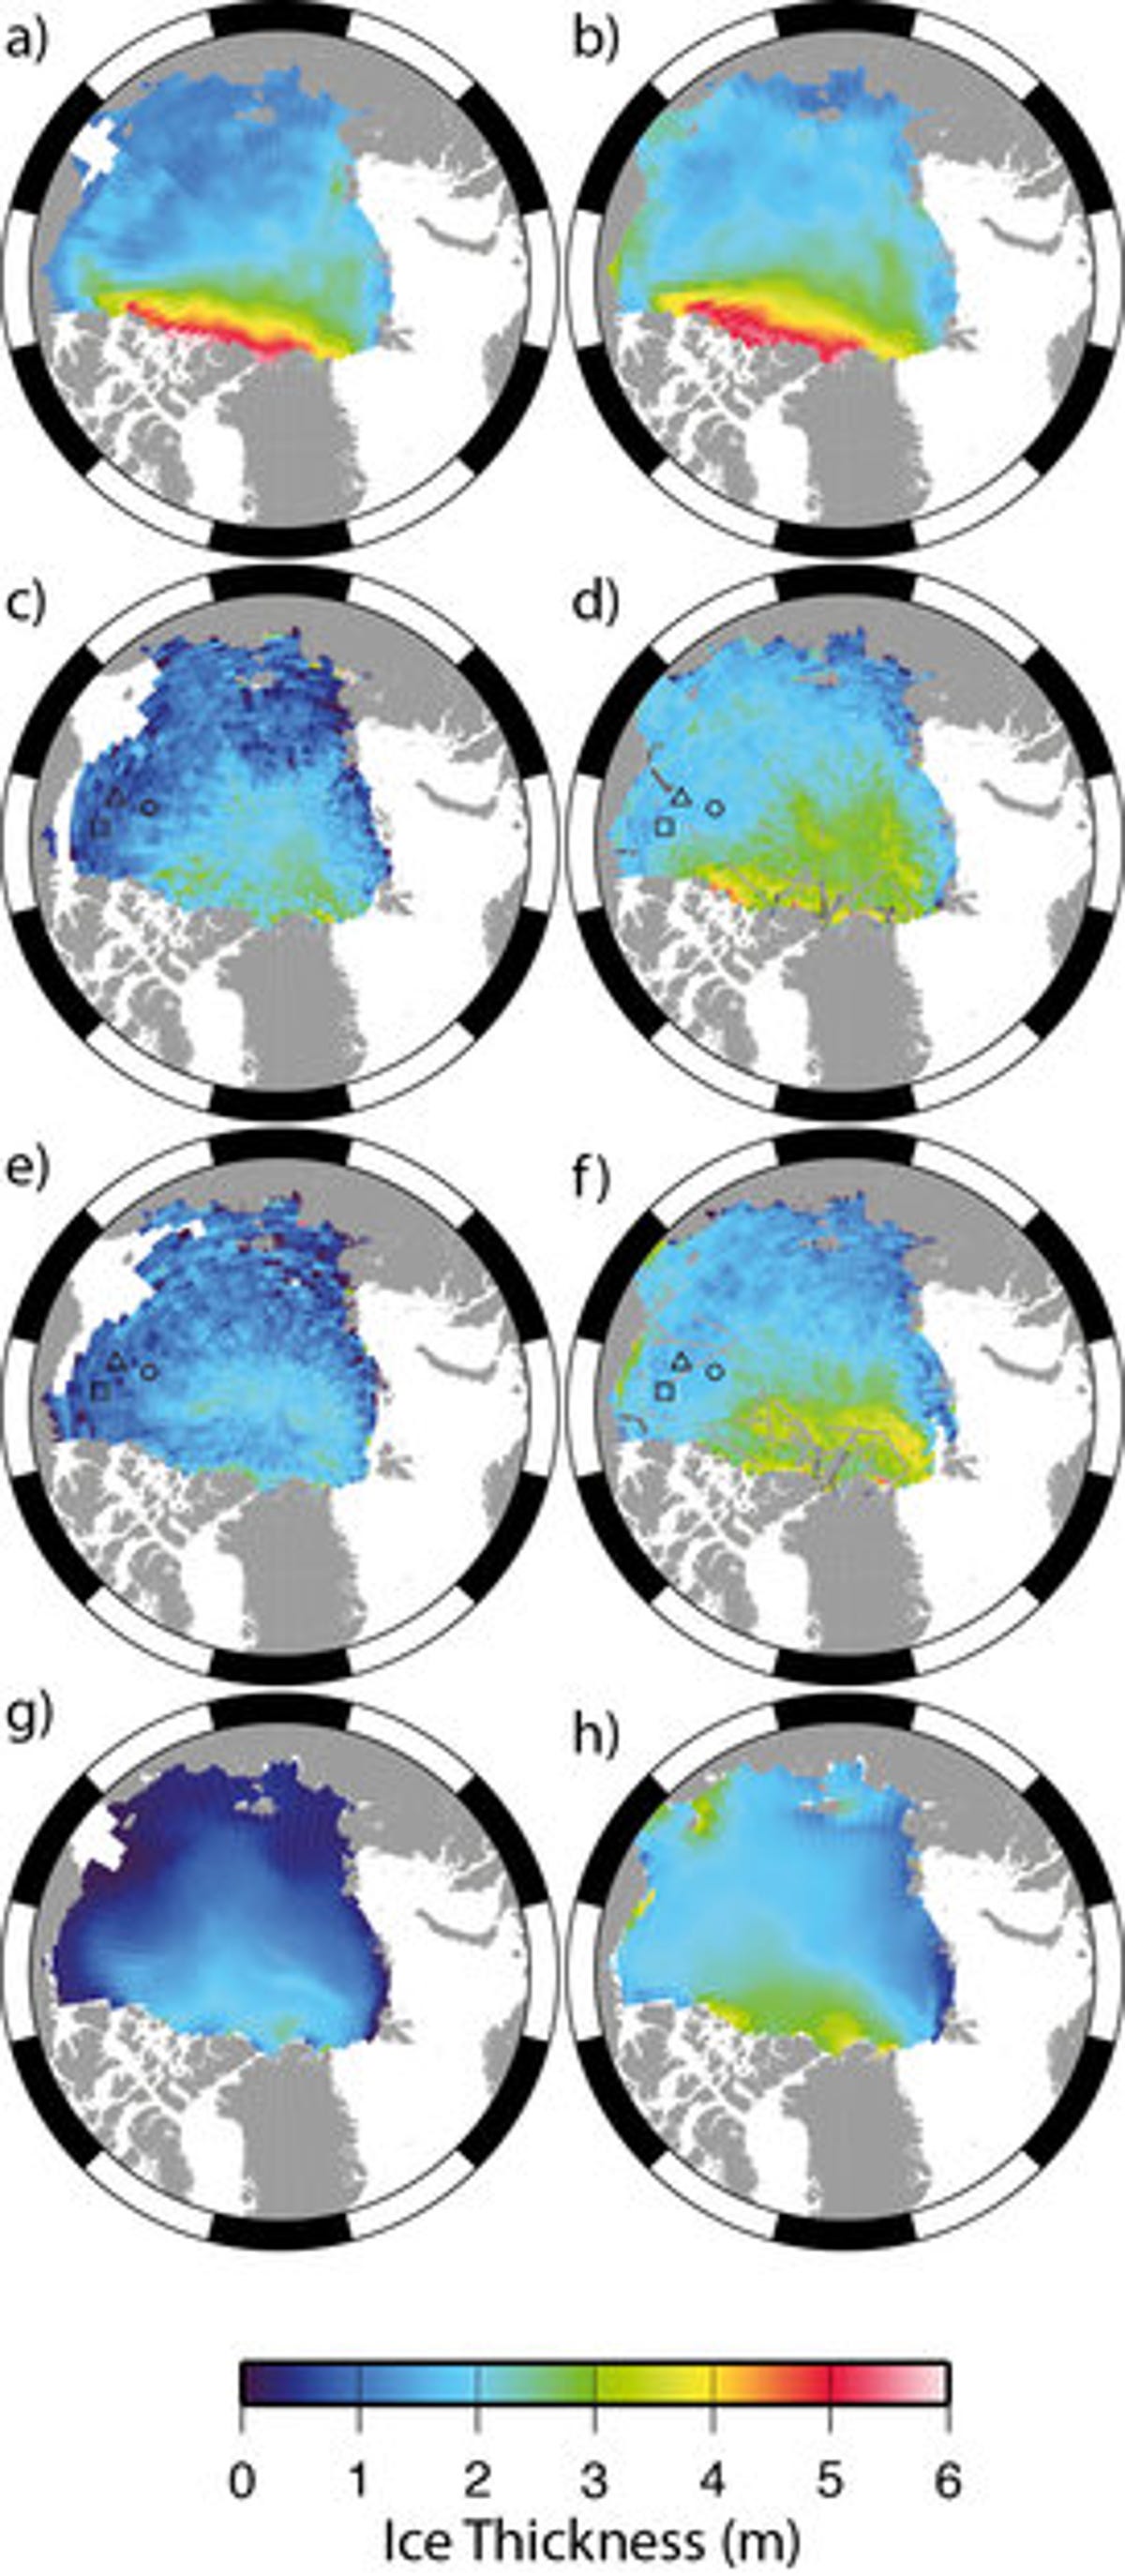
This graphic shows data collected from NASA ICESat, ESA CryoSat, and Pan-Arctic Ice Ocean Modeling and Assimilation System (PIOMAS) on sea ice thickness in the Arctic. Figure (a) shows the 2003-2007 average ICESat ice thickness for October/November and (b) the 2004-2008 average for February/March. Figures (c) to (f) are measurements based on CryoSat data -- for October/November 2010 (c), February/March 2011 (d), October/November 2011 (e) and February/March 2012 (f). The final two figures are based on PIOMAS measurements for October/November 2011 (g) and February/March 2012 (h).
2 of 8 ESA/US National Ice Center
Diminishing Arctic sea ice
"The data reveal that thick sea ice has disappeared from a region to the north of Greenland, the Canadian Archipelago, and to the northeast of Svalbard," said Katharine Giles, co-author of the study "CryoSat-2 estimates of Arctic sea ice thickness and volume," recently published online in Geophysical Research Letters.
This animation based on data from the U.S. National Ice Center shows the melting of Arctic sea ice from June 1 through August 24, 2011. Every year, the Arctic Ocean experiences the formation and then melting of vast amounts of floating ice, but recent data has shown the rate of overall loss of both coverage and thickness has accelerated.
The research data has confirmed for the first time that the decline in sea ice coverage in the Arctic polar region has also been accompanied by a substantial decline in ice volume. It also confirms the continuing decline observed from 2003 to 2008 by NASA's ICESat satellite.
3 of 8 ESA
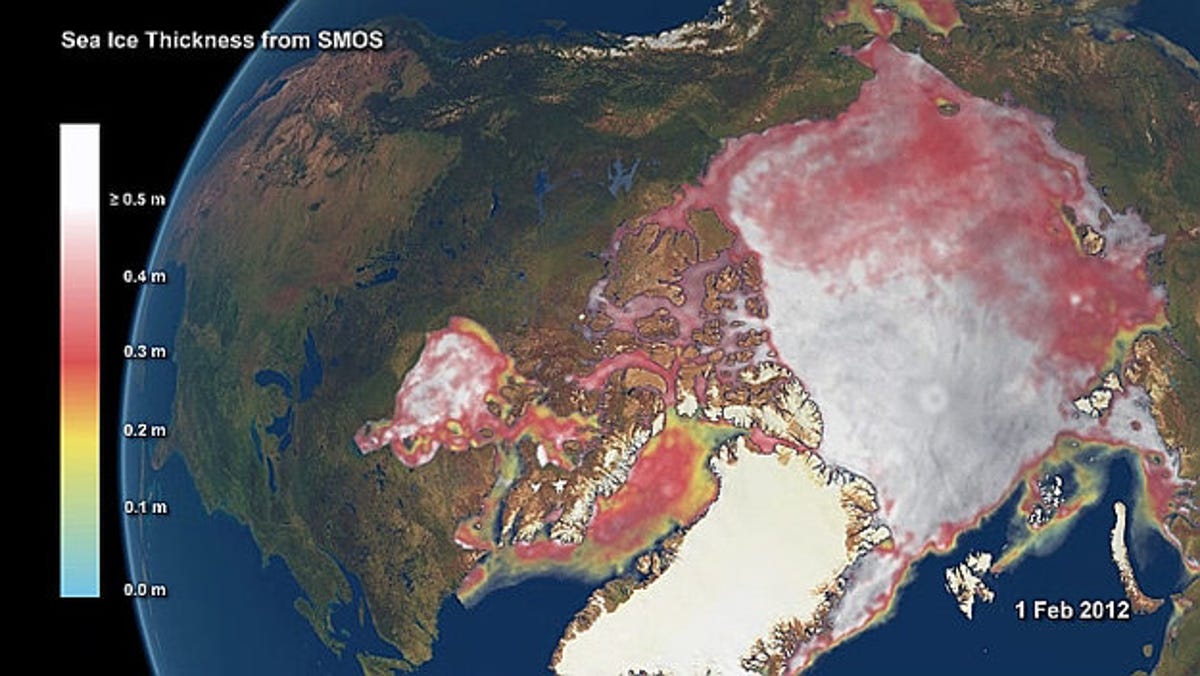
Looking deep into sea ice
Measurements from ESA's Soil Moisture and Ocean Salinity (SMOS) mission show that ice has thinned significantly in the seasonal ice zones, with extensive areas less than half a meter thick.
Sea ice has a large influence on the heat exchange between the ocean and the atmosphere. The heat flux can change depending on the sea-ice thickness and the air temperature. Sea ice is also affecting atmospheric circulation at midlatitudes.
4 of 8 USGS/ESA
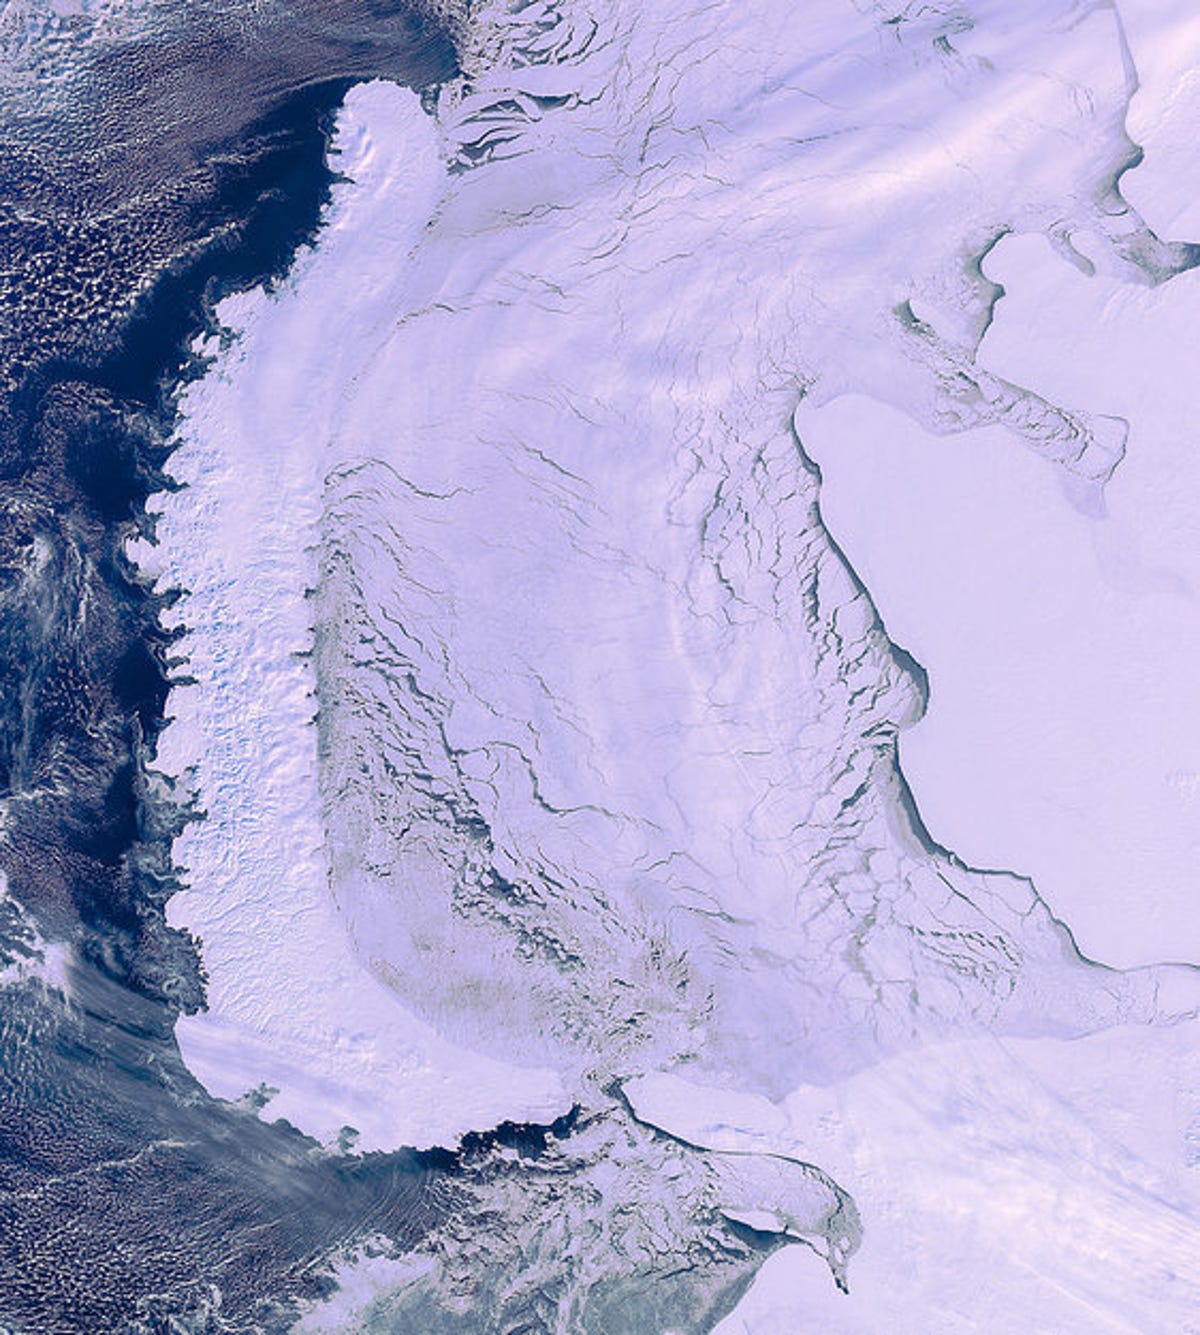
The Novaya Zemlya archipelago
This Envisat image from March 19, 2012 shows the islands of the Novaya Zemlya archipelago on the left, the mainland of northwestern Russia to the right, and an ice-covered Kara Sea in the center. The Barents Sea is off the island's west coast. Located completely within the Arctic Circle, Novaya Zemlya is an extension of the Ural Mountains.
Satellites such as NASA's ICESat and ESA's CryoSat have given researchers valuable data of changing conditions including coverage and thickness in these hard-to-reach areas.
5 of 8 USGS/ESA
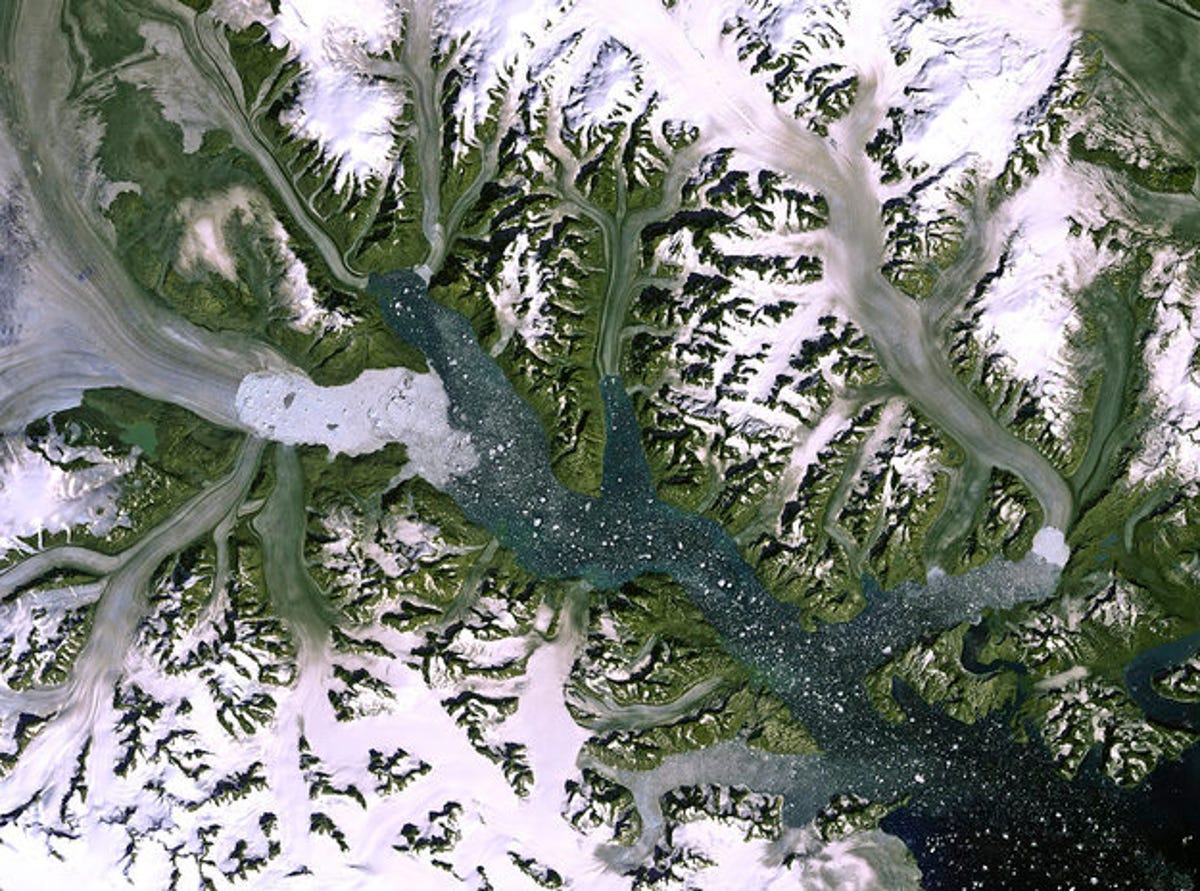
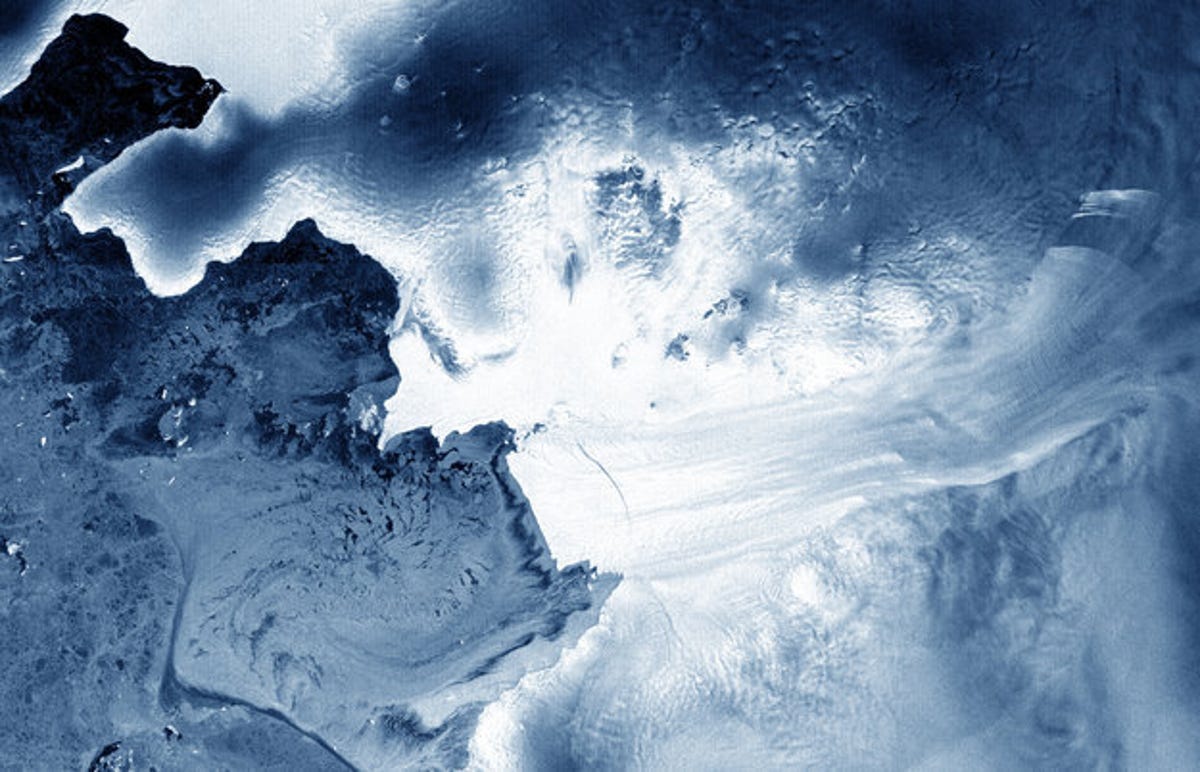
Kangerdlugssuaq glacier in Greenland
The Kangerdlugssuaq glacier and its ice stream are pictured in this image, acquired on September 19, 2012 by Landsat-7. It is the largest outlet glacier on Greenland's east coast, shedding ice into the surrounding oceans.
The recent data from satellite observations has revealed that over the past 20 years the ice melting in Greenland and Antarctica has contributed about 11mm to the global sea-level rise.
This image clearly shows the glacier's calving front, where ice breaks away, shedding hundreds of icebergs into the oceans.
6 of 8 Hakon Mosvold Larsen/AFP/Getty Images
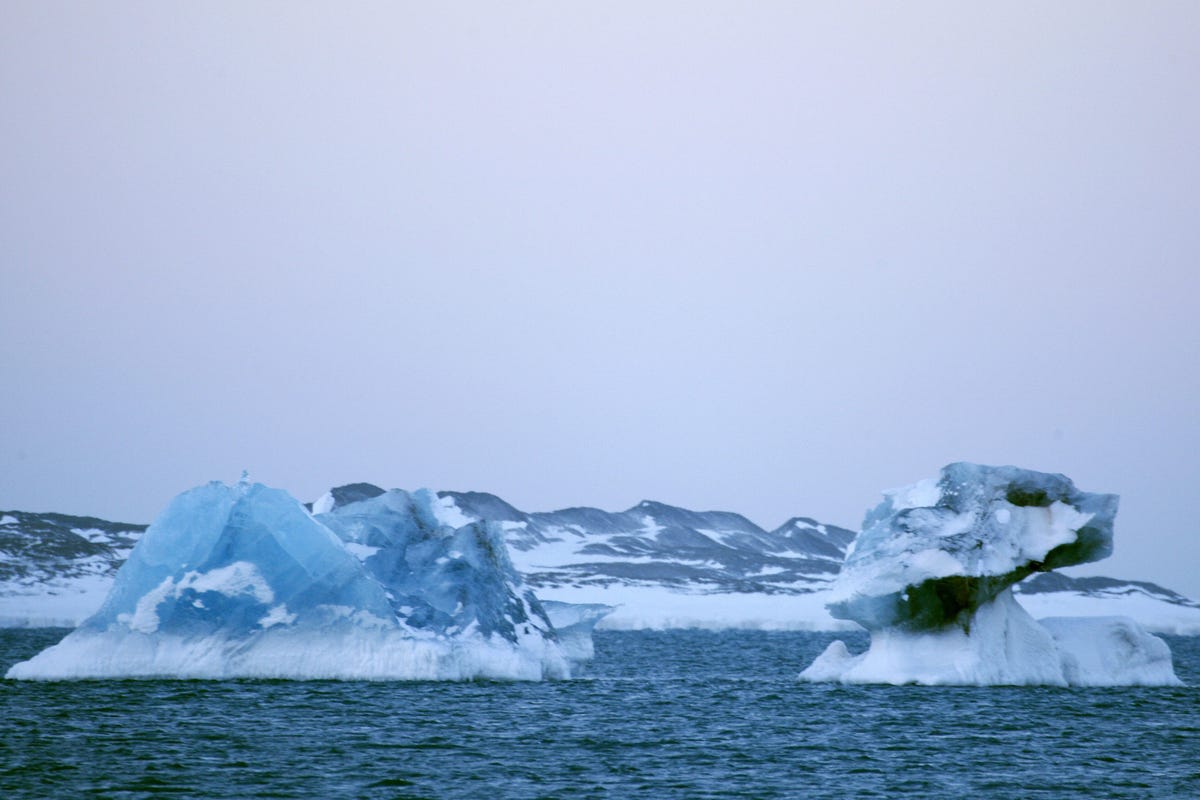
The edge of Kongsbreen glacial bay
The edge of Kongsbreen glacial bay, the Kings Glacier, is pictured on February 26, 2008. Kongsbreen, the most active calving glacier in Svalbard, has receded by about 4.5 kilometers in 30 years. For the third winter running the fjord is not frozen over due to warmer water on the surface, a warning sign of global warming.
7 of 8 ESA
Pine Island cracked
This Envisat image shows the Pine Island Glacier in West Antarctica and reveals a crack in the glacier's tongue about 25 kilometers long. The image was acquired by Envisat's radar on April 6, 2012.
8 of 8 ESA
Changes in Arctic sea ice
This animation compiled from data returned by the ESA's Envisat ASAR (Advanced Synthetic Aperture Radar) satellite of the Arctic Ocean highlights the changes in sea ice between June and September 2008. The dark gray color represents ice-free areas, while blue represents areas covered with sea ice.
"Other satellites have already shown drops in the area covered by Arctic sea ice as the climate has warmed, but CryoSat allows scientists to estimate the volume of sea ice -- a much more accurate indicator of the changes taking place in the Arctic," said Tommaso Parrinello, CryoSat mission manager.