Shrinking at a rate of 300 feet each year, the Pine Island Glacier alone is responsible for an incredible 7 percent of the world’s recent sea level rise.
James Martin
James Martin is the Managing Editor of Photography at CNET.
His photos capture technology's impact on society - from the widening wealth gap in San Francisco, to the European refugee crisis and Rwanda's efforts to improve health care.
From the technology pioneers of Google and Facebook, photographing Apple's Steve Jobs and Tim Cook, Facebook's Mark Zuckerberg and Google's Sundar Pichai, to the most groundbreaking launches at Apple and NASA, his is a dream job for any documentary photography and journalist with a love for technology.
Exhibited widely, syndicated and reprinted thousands of times over the years, James follows the people and places behind the technology changing our world, bringing their stories and ideas to life.
In October 2011 NASA's Operation IceBridge discovered a gigantic rift in the Pine Island Glacier during research flights over Antarctica carrying radar and lidar equipment for measuring ice thickness. The rift quickly became the focus of international scientific concern, and the crack grew rapidly, with a 280-square-mile chunk of the glacier breaking off to form an island of ice.
NASA says the Pine Island Glacier is one of the largest single contributors to sea level rise in recent years. Shrinking at a rate of 300 feet each year, the glacier is responsible for an incredible 7 percent of the world's recent sea level rise.
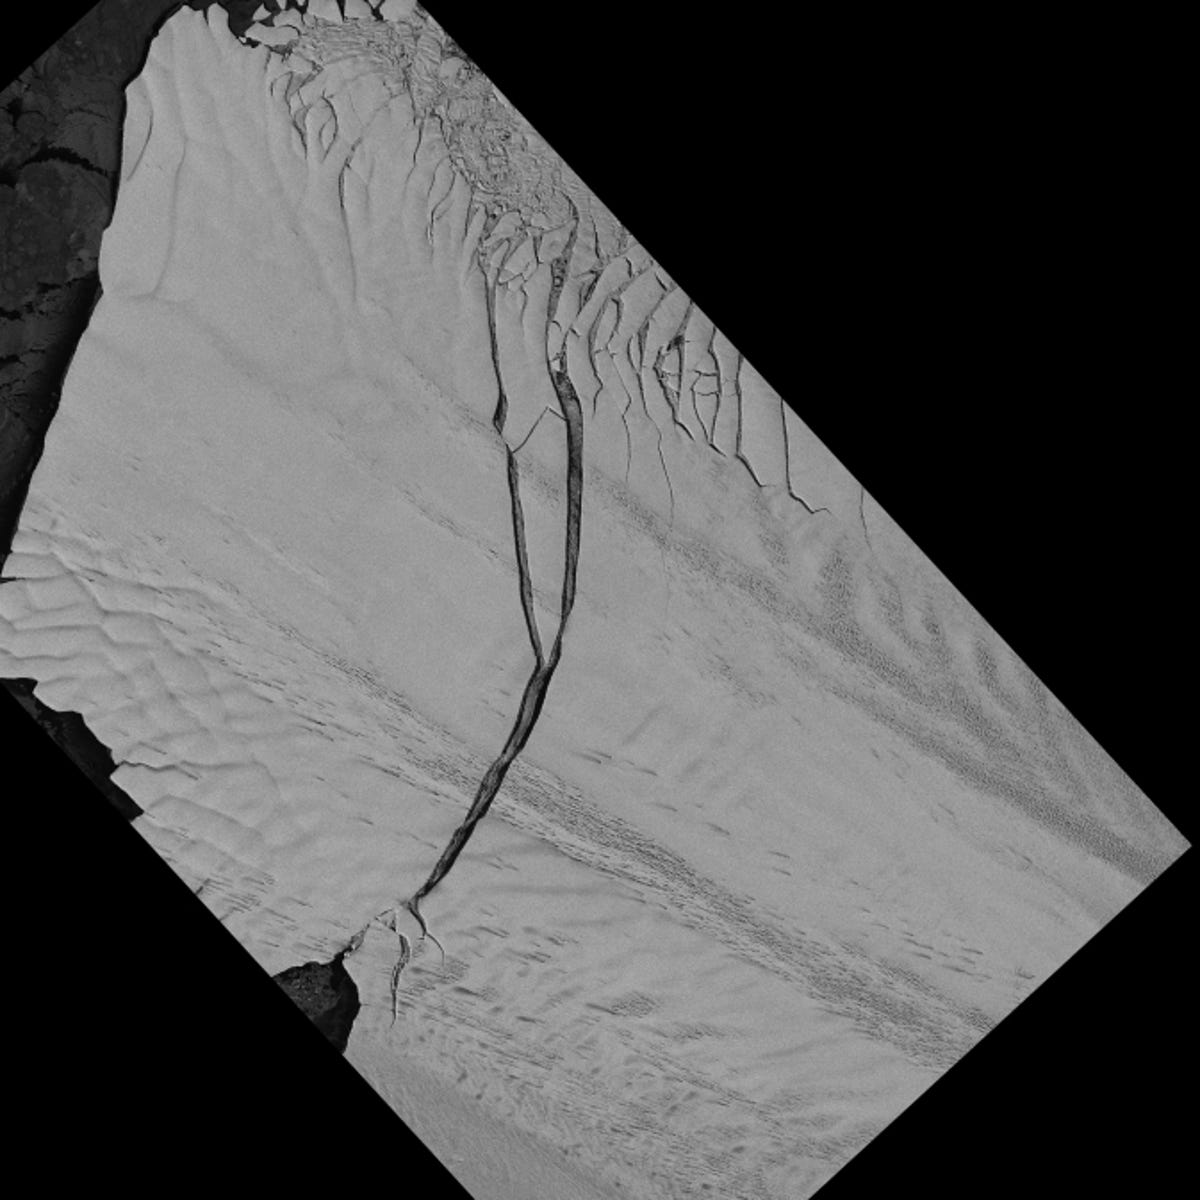
This week the German Aerospace Center's Earth monitoring satellite TerraSAR-X confirmed that the rift had run its course, and a large iceberg had indeed broken off of Pine Island Glacier, one of Antarctica's largest, fastest moving, and most important ice streams.
This image of the calving glacier was captured on July 8, 2013, by TerraSAR-X, which has been keeping a close watch on the rift using a radar instrument capable of making observations through even the dark months or heavy cloud cover.
2 of 6 NASA / Michael Studinger
Observing the 18-mile-long rift
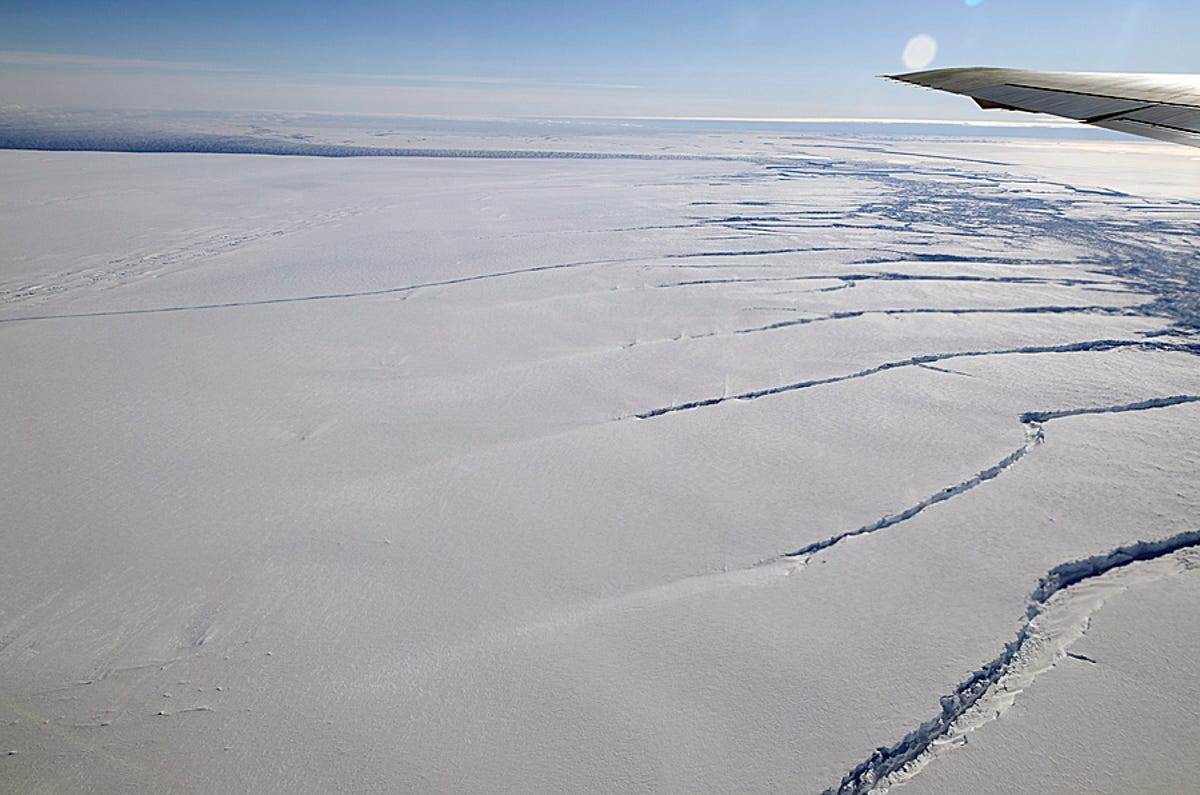
Soon after discovering the 18-mile-long rift, IceBridge researchers flew along the crack to get a closer look and measure the width, depth, and thickness of the ice. Their instruments include ice-penetrating radar and a gravimeter to measure ice thickness and depth, as well as determine the shape of water beneath ice shelves and map the subglacial bedrock.
IceBridge project scientist Michael Studinger called the research trip "a great opportunity to fly a suite of instruments you can't use from space and gather high-resolution data on the rift."
Here, the ice shelf crack is seen from NASA's DC-8 as it flew over the Pine Island Glacier Ice Shelf on October 14, 2011, as part of the agency's Operation IceBridge.
3 of 6 NASA / DMS
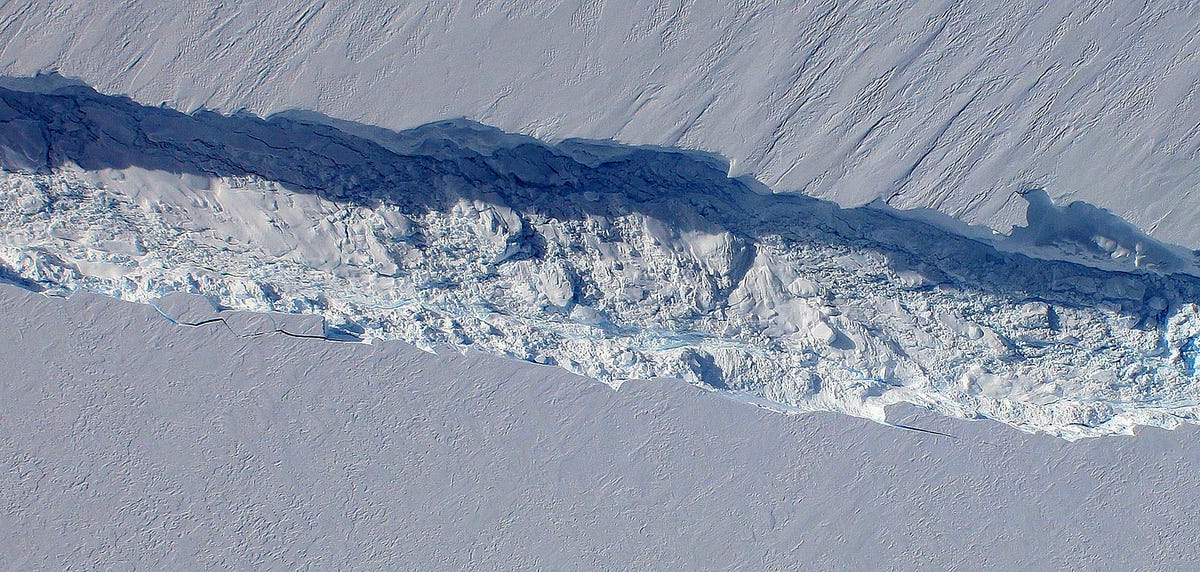
View from NASA's DC-8
View of the Pine Island Glacier rift from the Digital Mapping System camera aboard NASA's DC-8 on October 26, 2011.
4 of 6 NASA/JPL-Caltech/UC Irvine/Columbia University
Rates of basal melt
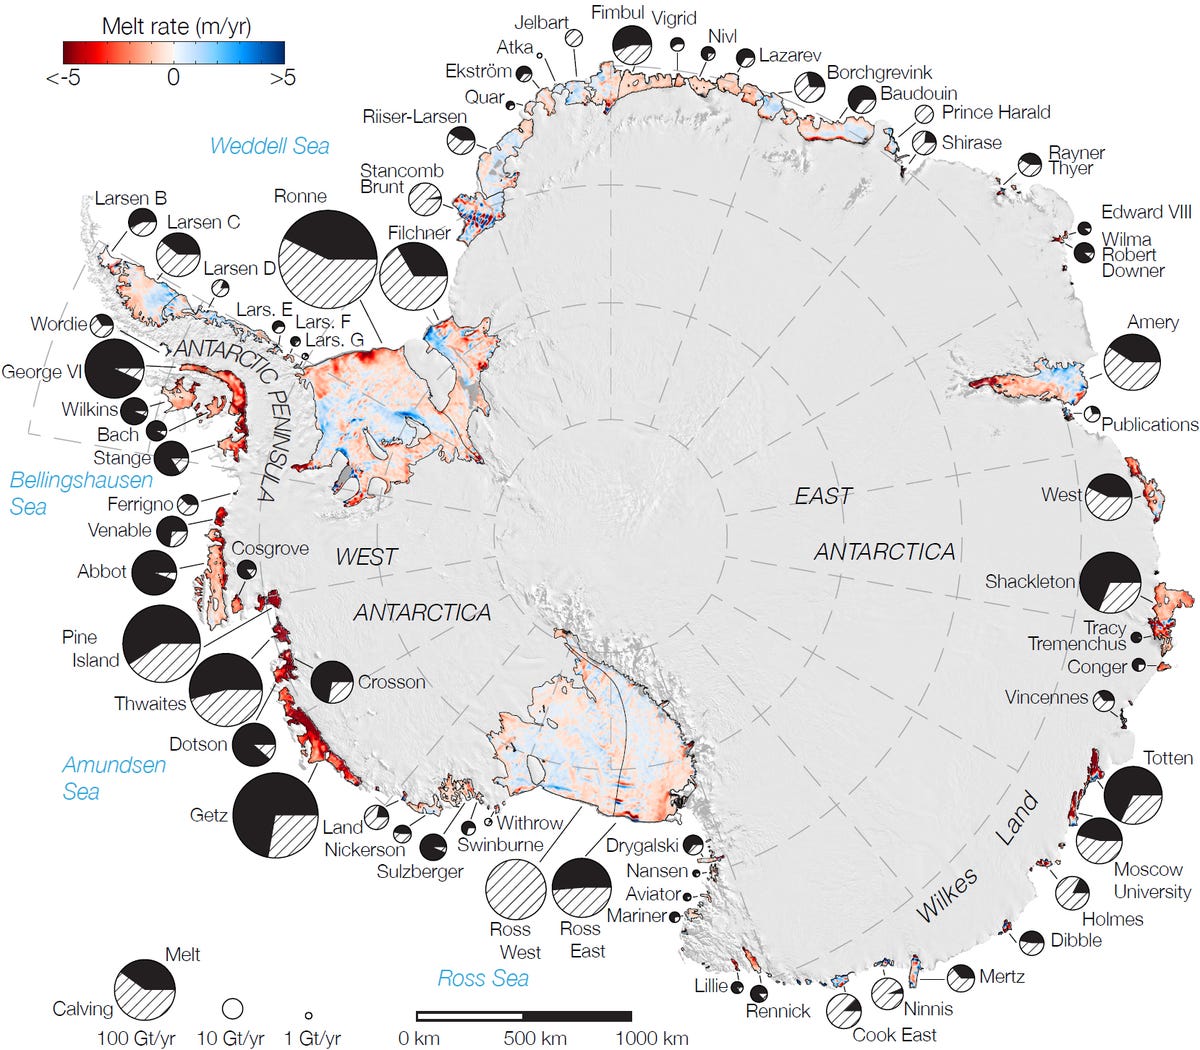
Rates of basal melt, the ice that melts from underneath the ice shelves, is seen here overlaid on a 2009 mosaic of Antarctica created from data from NASA's Moderate Resolution Imaging Spectroradiometer instrument aboard NASA's Terra and Aqua spacecraft.
The red shades denote melt rates of less than 5 meters per year, while blue shades represent melt rates of greater than 5 meters per year. The perimeters of the ice shelves in 2007-2008, excluding ice rises and ice islands, are shown by thin black lines.
Each circular graph is proportional in area to the total ice mass loss measured from each ice shelf, in gigatons per year, with the proportion of ice lost owing to the calving of icebergs denoted by hatched lines and the proportion due to basal melting denoted in black.
5 of 6 NASA/GSFC/METI/ERSDAC/JAROS and U.S./Japan ASTER Science Team
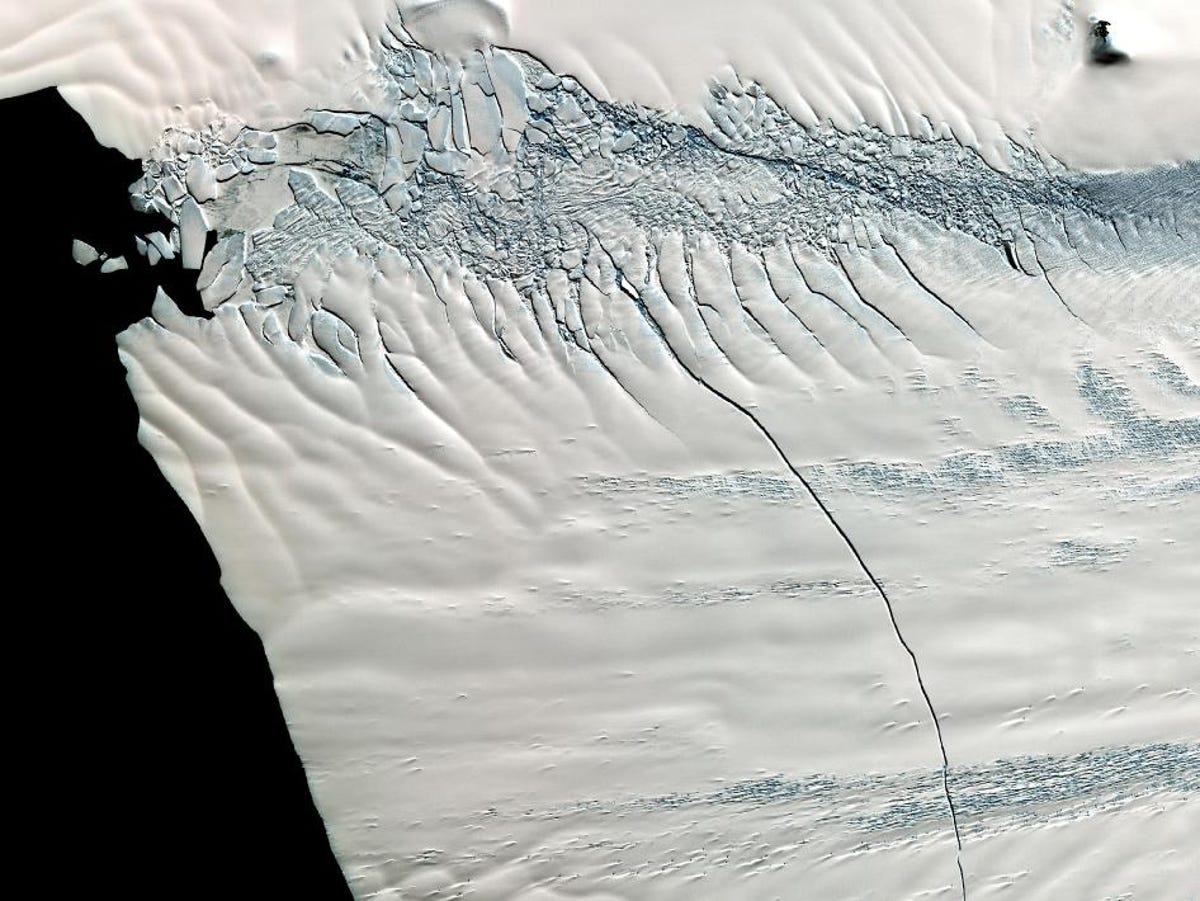
260 feet wide and 195 feet deep
Extending for 18 miles, the crack across the Pine Island Glacier was 260 feet wide and 195 feet deep. Eventually, the crack grew across the ice until it calved a giant iceberg that measured more than 250 square miles.
This image, from the Advanced Spaceborne Thermal Emission and Reflection Radiometer (ASTER) instrument on NASA's Terra spacecraft, was captured on November 13, 2011.
6 of 6 Landsat 7/NASA
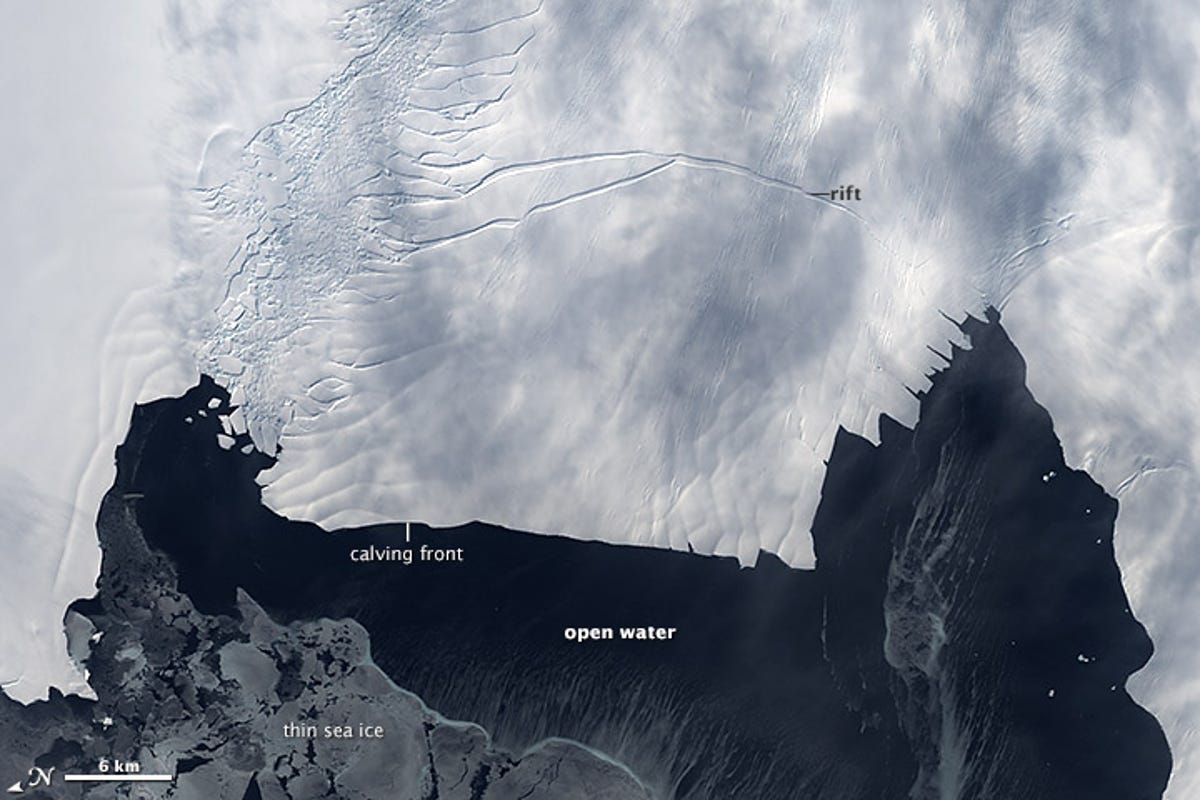
Rift reaching the end of the shelf
This image, captured by the Enhanced Thematic Mapper on Landsat 7, shows the rift on October 26, 2012. The rift still had a few more kilometers to go before reaching the other end of the ice shelf. The arrival of spring in Antarctica had cleared much of the floating sea ice away from Pine Island Glacier’s calving front.