Data made fun with Swivel
Swivel is a searchable database of charts and data on a variety of subjects.


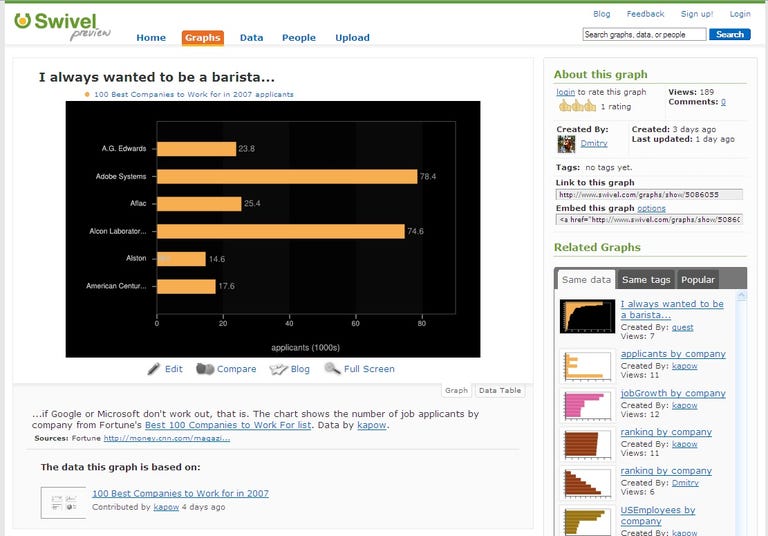
Swivel is a data visualization service that lets you add your own data sets or search from a large pool of public submissions. If this sounds boring, it shouldn't. It's actually kind of fun and very similar to browsing Flickr. Data is presented in several ways, from pie charts to bar graphs to scatter plots. You can also easily tab over in any graphical chart representation to get the raw chart numbers. Where was this when I was in college?
Most of the content on Swivel is fairly bland, such as the prime loan rates for banks, but there are also some fun charts there, such as the amount of money spent on lobbying and the percentage of alcohol in various brands of beer. Users can comment on any data set and rate it as well. Swivel also keeps track of chart views and viewer interest to promote popular charts to the front page.
It's free to host your data on the site if you want to make it public, but if you're using Swivel for business purposes, there's a fee. I'm not really sure who will want to use this service outside of stats junkies, but I can easily see the value of Swivel to students who want easy-to-understand, searchable charts and stats for term papers.