Am I bats? Part 2
If at first you don't succeed...go truly high tech!


I don't know about you, but there was a lot of excitement at the Tiemann household when this image popped up on the screen. It meant that nights of field work, evenings of programming, and a weekend of multimedia production all pointed at one, inescapable conclusion: my crazy bat project was a SUCCESS and the promise I made to my daughter was KEPT!!
First things first. If you have been following this blog, you know that a week ago I had the crazy idea of trying to record bats. After finally having an opportunity to use my aforementioned SONY PMC-D1, and after spending another few hours trying to convince myself I had captured something, in the end I felt a bit like one of the members of the Warren Commission looking at the Zapruder film and asking "you want me to make a finding based on this?" If I was going to convince my daughter that we had, in fact, captured and identified bat sounds beyond a shadow of a doubt, it was going to take more than a few suspicious noises of post-processed audio before I could be satisfied that the burden of proof could be met. In the days after my first blog posting, things were looking fairly bleak for the project, but I was determined to prove that with a little technology (a little more than you might suspect), I could, in fact, make good.
Not that she wasn't ready to be convinced. When I played her a slowed-down version of the audio we captured, she heard some faint sounds and was ready to declare "MISSION ACCOMPLISHED", quickly followed by "Can I have some ice cream now?". But I wanted to show her that science is not about being satisfied that maybe something you already believed could possibly be true. It's about doing an experiement which, when done correctly, causes every other observer in the room to say "WOW! YOU REALLY GOT IT!". Maybe I really am bats to shoot for such a standard, but that's the standard my father set when he was teaching science to my brother and me.
Let's start with where I went wrong. Even my daughter, who will be entering 3rd grade this year, knows that humans cannot hear bats. Through my own experiments using a signal generator, I know that nearly every 1st-3rd graders in my daughter's class can readily hear test signals up to at least 20 kHz. Sadly, due to long-term environmental noise pollution (caused by the reckless policies of most live music venues, poorly designed and regularly abused airplane PA systems, and the absurd levels of volume that police car and fire truck sirens produce), I cannot hear even 16 kHz test signals, let alone the 17 kHz ringtones favored by today's adolescents. My plan was to use a high-end DAT recorder capable of recording a 48 kHz signal (more than 3x the upper limit of my hearing), using its high-quality built-in microphones to convert the bat calls to electrical signals. This was my first error.
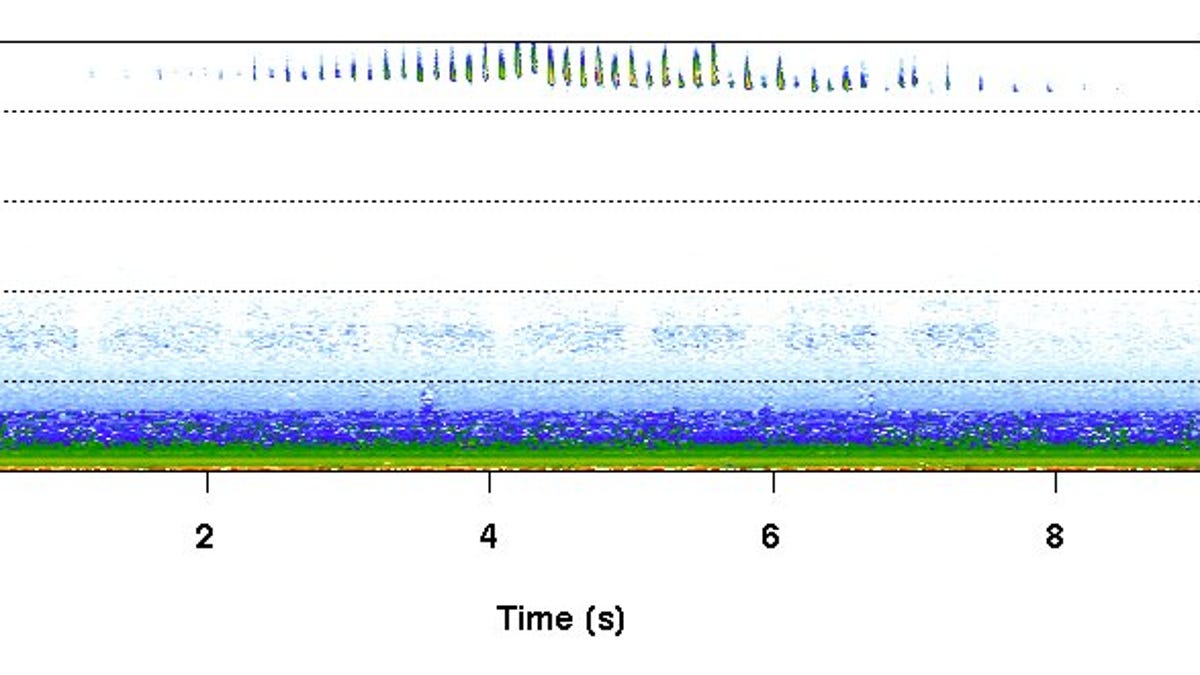
The built-in microphones have a boosted response between 10 kHz and 20 kHz, but then sensitivity falls off a cliff, dropping nearly 30 dB (a factor of 1000x) at 30 kHz from its peak sensitivity around 16 kHz. That's not a problem for music, but for bats? Well, using a spectrogram (that provides a visual representation of sound frequencies over time), you can see the problem quite clearly. In the following image, each frequency band is color-coded with its intensity: signals beyond the specified range are white; a really faint signal (bordering on noise) is sky blue; weak signals range from sky blue to deep blue; medium signals range from green to yellow; and strong signals range from yellow to red.
As you can see in the above image, there's lots of stuff happening up to almost 5 kHz (which roughly corresponds to the range limits of our own pitch perception--notes we can play on the piano). From 5 kHz to 10 kHz (which is no longer perceived as pitch, but rather sounds like various types of noise--cracking, sizzling, sliding, and the grating noise of bugs in the forest), there's still a bit going on, but much less. And from 10 kHz to 20 kHz (which starts to go beyond what many people can hear), there's less still. What you can see, though it is very indistinct, are eight small smudges in the upper left-hand corner, ranging on the scale from about 46 kHz to 48 kHz. Yes, those are bats calls, but looking at the energies, they are "lost in the noise". We're using the wrong tool for the job because we're forced to rely more on our imagination than the evidence to conclude what a bat call might sound like.
I went to the World Wide Web to try to identify what sort of bats we might be trying to record, so as to make sure I had the right equipment. I quickly found that the two most likely candidates were the Eastern Red Bat and the Big Brown Bat, both of which are prevalent in the South East.
 I thought the Eastern Red Bat more likely, though, as they seem to favor hunting around streetlamps, whereas the Big Brown Bat is merely common and wide-ranging. As I was folding laundry that evening I found myself face-to-face with a depiction of an Eastern Red Bat on a T-shirt we purchased at the 2003 Fesitval for the Eno River, and that clinched it for me: I was going to optimize for the Eastern Red Bat. (It turns out that both have virtually identical echolocation frequency ranges, so equipment that worked for one would work for the other.)
Research teaches that the peak audio frequencies of the Eastern Red Bat range from 35 kHz to 45 kHz, just under the 48 kHz theoretical maximimum of my 96 kHz sample rate, and well above the useful range of my built-in SONY mics. For this job I selected a pair of Earthworks QTC-40 microphones. Even though these are omni-directional microphones (and hence one should suffice), the
 shows that these microphones start to become directional above 10 kHz, increasing out to 50 kHz, and beyond 35 kHz, their off-axis reponse curve is not even shown. What all this means is that the microphone works best when it's pointed at the bat. By using two microphones aimed 45 degrees up in opposite directions, I could record bats coming and going, literally. I used a pair of Speck Mic Pre 5.0 microphone preamps (good to -3 dB at 200 kHz) to feed line-level signal into the PCM-D1. I mounted the microphone pair atop a 6' pole, and then waited for night to fall and the bats to begin their breakfast.
Though not a specific objective of the experiment, we both determined that my daughter's eyes are both more acute and more sensitive than my own. She was quite a champion at seeing the bats flying in the dim light, and she correctly suggested that I move my microphones to where the bats where flying, rather than leaving them on the ground most level and convenient for my comfort. We recorded bats for about one hour, and then I retired, full of bug bites, for the evening. (Note to self: we need more bats if we want fewer bugs!)
Now the real challenge began: how to present the data in a clear and compelling way.
If you are one of the five remaining people reading this article, you will appreciate the fact that the Web is still primarily a visual medium--one that favors text and images. I didn't want to post audio files without being able to give a clear picture of just what the listener could expect. Rather, I wanted to achieve both auditory and visual confirmation.
To render the soundscape of my bat recordings, I turned to Jérôme Sueur's seewave package. This package extends the R environment for statistical computing and graphics to do just what I needed. Seewave is one of literally hundreds of add-on modules that make R one of the richest mathematical playgrounds I have ever found. Seewave depends upon
The sound package supported sample rates up to 48 kHz, and it supported only 8-bit and 16-bit sample formats. I had 24-bit samples at 96 kHz, a problem on two fronts. This minor inconvenience took me back to the nights I'd spend with my father working on projects that were supposed to be straightforward, but always became more complicated as we made them "our projects". I remember one time (must have been in 1976) he brought home a Cromemco TV Dazzler, which offered a stunning 32 colors with 128x128 resolution (0.016 megapixels!). After installing it into our IMSAI 8080 and connecting it to what might have been the only color TV in the house, I was mesmerized by the Kaleidescope program that came with the boards on paper tape.

"That's nothing," my father told me. "I've got the program here for SPACEWAR!" I must have said something like "Cool! Let's play!" to which he replied: "OK. But first we have to build the joystick controllers." And he proceeded to rummage through his collection of aluminum chassis boxes until one seemed large enough for a pair of knobs and a pair of buttons. A few evenings later I became the first kid on my block with an honest-to-goodness video game that I helped build. I never developed his knack with hardware and mechanical construction, but I did develop quite some software skill, which is quite valuable considering that there are now hundreds of millions of lines of open source software. All of this code is waiting for somebody like me to identify a need, decided what knobs and/or buttons will work best, and then get down to the business of creating something new.
Source Code To The Rescue!
I dusted off my programming skills, found some documentation for the Microsoft WAV file format, and proceeded to modify the source code of the sound package to meet my needs. (And if you think that's cool, just imagine what happens when millions of other developers like myself are free to add the features they need when they need them, or what happens when hundreds of thousands of these millions of developers spend 10+ hours/week tending their open source gardens. No wonder I've got such rich software tools to play with!)
With that change, I was ready to create my closeup. I used Audacity to slice out a relevant 9 seconds of audio from a longer recording, saved it out in all its 96 kHz/24-bit glory, ran the following script in R,
library(seewave)
library(sound)
s<-loadSample("bats96k.wav") bats96k_L<-data.frame(sound(s)[1,])="" op<-par(font="2,font.axis=2,font.lab=2,font.sub=2)" spectro(bats96k_L,f="96000,wl=4096,ovlp=75,zp=128,collevels=seq(-50,-10,0.2))" #="" bats96k_R<-data.frame(sound(s)[2,])="" spectro(bats96k_R,f="96000,wl=4096,ovlp=75,zp=128,collevels=seq(-50,-10,0.2))" <="" pre="">
and Voilà! To see what I'm talking about, fire up your favorite 30" display (or a pair of windowed displays that provides at least 2560 pixels of horizontal resolution) and tell me you cannot see the bat calls in this image:
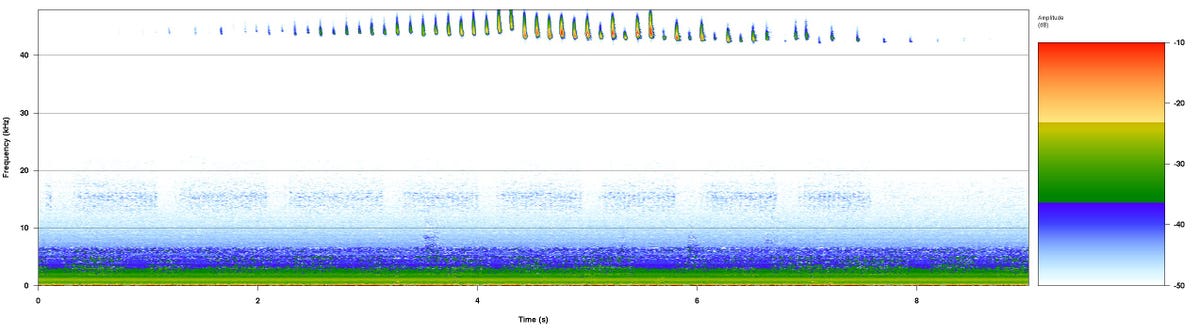
If you want to play with this yourself, you can click-save the 9 second, 96 kHz stereo .wav file. You can hear me talking (30' from the microphones) as I see the bats approaching. Thankfully the bat's calls fly high above my 200 Hz-2.5 kHz range. If you just want to listen (but don't need the original data or the 96k sample rate), there are compressed ogg and mp3> versions here. (I prefer Ogg format to mp3 because it is more compact, higher quality, and free from software patents, which are harmful to software innovation and devastating to software freedom.)
If you want to hear what these bats sound like when slowed down by a factor of 10 (so that their 40+ kHz calls are played in the 4 kHz range), then have a listen to this in ogg or mp3 format. There are 18 seconds of intro, just so you can get used to the sonic landscape p-l-a-y-e-d s-l-o-w, and then you should hear chirping about 1x per second, first in the left channel, then getting louder as it moves to the center and then to the right, before fading out. At full speed, these chirps would be coming at almost 10x per second, or about one ever 110 ms, just as science predicts! And, of course, they'd be over 40 kHz--too high to hear. I hope you have fun!
P.S. To my father who taught me how to follow wherever science leads, YOU ARE TOTALLY AWESOME! Thanks!